Will The Generals Show Up?
The
major indices and certainly the banks and retail gave
us an oversold pop from the extended volatility band zone. On a closing basis,
the SPX
(
$SPX.X |
Quote |
Chart |
News |
PowerRating) just barely closed above the midpoint on an outside day,
up +1.7% on the day, while the Dow
(
$INDU |
Quote |
Chart |
News |
PowerRating) closed +1.06%, BUT with a lower
low and lower high day and just barely above the midpoint.
NYSE volume expanded to
1.9 billion, about 40% above average, which is a positive, but not all the
Generals were believers, as the volume ratio was just 58, and as you know, I
watch this number and its three- to four-day moving average very closely. Volume
will most often precede price. Breadth was a very strange negative at -200, so
that tells me that much of the action was in programs and certainly some short
covering. It was far from an explosion day by the Generals.
From a trading
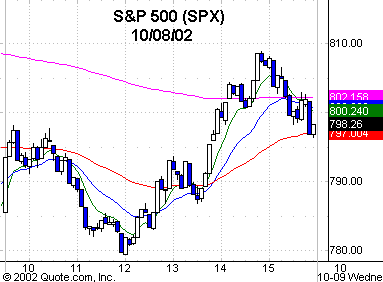
standpoint, the SPX gave us a moonshot trade from an RST, then a 1,2,3 entry.
After the gap up opening, the SPX traded up to 798.10 and then made a double top
pattern that carried down to a 779.50 intraday low, which was the signal bar
top-of-the-range close. 779 is also the measurement price objective to the
downside from the head-and-shoulder pattern on the daily chart. It was an inside
bar pattern entry and also the RST entry above 781.90. You got a 1,2,3 entry
either above 785.38 or 786.87. Either one was correct. The moonshot was to an
808.86 intraday high, but backing off in the last hour to close at 798.26.
If the Generals were
there in size, that wouldn’t have happened. We need them to show up today to
spend some money for any move to succeed. I thought the Program Gang would shake
the tree yesterday and take out the 775.68 SPX low when so close, but someone
defended it, as the SPX and futures ran about 28 points.
At this juncture the Dow
and Nasdaq, NDX 100, S&P 400 and 600, Russell 2000, Wilshire 500, Valueline,
arithmetic and geometric indices have all taken out their July lows. The SPX,
NYSE Composite and OEX are all right on the doorstep. If the Generals’
perception — because there’s not real earnings — change once again beyond the
immediate quagmire, then you will see the Morgan Stanley Cyclical Index, which
is the CYC, reverse its 400 September 2001 low. It closed at 389.
What does most everything
in this economy revolve around? Correct — chips. So, the SOX has to turn and
give you some semblance of an entry pattern on the daily or weekly chart. The
RTHs, which are the retail HOLDRs, must do the same, and certainly the banks and
brokers. Net net, stop playing the "Is it or isn’t it the bottom?"
game and looking at just one index and let the entire market guide your decision
to commit any hard-earned long-term money.
For conservative position
traders and investors, you just need to catch the strongest leg of the bull
market, which would be leg 3 for those familiar with basic Elliot Wave. If you
can do that, then as they say, you’ve done good. With all the damage this second
worst bear market since 1929 has done to individuals, don’t you think it will be
a staircase move up if and when, rather than a "V"? There are millions
of people that have held on to their buy-and-hold stocks, which has cost many to
lose 50% to 60% of their retirement money. An absolute disaster.
Human nature being what
it is means that there will be an ample supply of stock on the way back up.
There ain’t no rush, bud. Focus on the daily and weekly charts for confirmed
entry patterns, and that will tell you which way the train is heading.
Aggressive traders that utilize option strategies like covered combos and other
scale-in strategies are already in this market zone below 800. But that is a
totally different approach and only for the most experienced and well
capitalized.
The SPX is in leg 5 on
your 60-minute chart from the 965 high, and if 775.68 is broken, the 770 – 750
zone would probably be the extent of the downside before a very strong reflex.
If the index breaks the July low, then a 1,2,3 lower bottom pattern is in
effect, and entry would be a reversal back up through that low, provided it
doesn’t come from below 700. Let’s start looking for some closes above the high
of the low day before we get excited.
Have a good trading day.

Five-minute chart of
Monday’s SPX with 8-, 20-,
60- and 260-period
EMAs

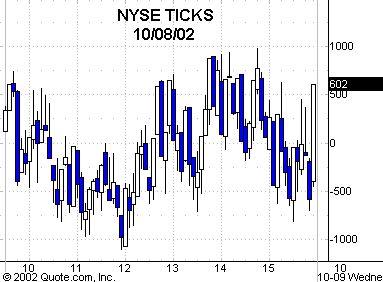
Five-minute chart of
Monday’s NYSE TICKS
