Work In Progress
All of
the major indices and sectors finished red
on the lightest NYSE volume of this
current reaction, which was 1.2 billion, about 15% below its average. The volume
ratio was 28, for a short-term oversold three-day moving average of 24, while
breadth was -577. It was the fifth lower close and fourth lower low for this
reaction, and yesterday was a minor cycle day.
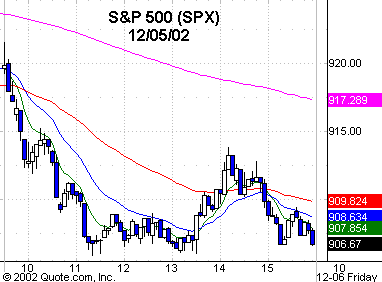
There were two initial
reversal opportunities after the 911.55 low and 909.06 low, both of which
scratched for small losses. Some of you played the continuation shorts after
those failures, but I preferred not to because the SPX was entering an
inflection point zone that included the 20-day EMA at 913.13, the 89-day EMA at
906.92, and the 1.618 Fib extension of the 912.42 – 925.25 leg up on Wednesday,
which was 904.50. Also, there was the .618 retracement to the 872.05 low from
954.28, which is 903.46. Just below that, there is the 50-day EMA at 899.35. No
great reason to scalp the five-minute downtrend into a confluence of five
numbers where there was a possible reversal all within 6 points.
Looking at the 20-day
five-minute chart, you see that the decline since Monday’s 954.28 high is a
retracement of an uptrend that started from the Nov. 13 872.05 low, so the
decision was to play the reversal from this zone if it set up, even though the
box score was 0-for-2 on the SPYs to that point.
After a flash sell
program, there was a reversal bar setup with entry above 907 following the
905.90 intraday low. You didn’t get stopped out on this one if you held it, but
it went sideways in a Slim Jim between 909 and 906 for two hours before running
to 914, which was the .618 retracement to the 921.49 intraday high and was a
good out and then a short opportunity because this .618 retracement was below
the previous close and yesterday’s open.
The SPX then traded down
to a 906.67 close. The point is 0-for-2 doesn’t end your day. Stay with
high-probability situations. Be consistent because there are lots of trades to
take over the year. If you take two or three probes and lose them all, don’t
lose your confidence when a stronger-looking trade sets up and you don’t take it
because you lost two or three in a row that day. This assumes that you adhere to
your risk management parameters because if you don’t, you will doing something
else very quickly when your capital is depleted.
The
(
SMH |
Quote |
Chart |
News |
PowerRating)s gave us
three defined 1,2,3s yesterday. The first was a 1,2,3 lower top sell below
26.88. That carried down to an intraday low of 25.85. And then a 1,2,3 higher
bottom set up following that low with entry above 26.04 which carried up to
26.81. Some of you might have even taken a third one, which was a 1,2,3 lower
top sell with entry below 26.60, or else the trend entry below 26.50 on the 2:50
p.m. ET bar. This only carried down to 26.17, then went sideways for the last 45
minutes, closing at 26.17. I believe I said in yesterday’s text that the SMHs
would probably get a quick reflex from the 25.25 – 25.85 zone.
This is the eighth week
up, not counting the 769 low week, and unless it rallies today, it will be a key
outside reversal bar week with a probable close below the previous week’s low,
and maybe even below the previous three weeks’ closes. The Generals didn’t show
up to put new monies to work this week, even though there was a futures-induced
spike to 954.28 on Monday, which is just under that 965 resistance zone. You
have the 954.28 to 768.63 low framed and know those levels. There is a decent
confluence from the .38 retracement of 883.36 through 890, and then a stronger
one at 860 – 865. I also said that if this market is for real, that the 840 .618
retracement zone should hold.
The Nasdaq and NDX weekly
charts give you the same look as the SPX and Dow. This is also confirmed by the
SMHs, the XBD, the BKX, the RLX, and also the MDY, which is the mid-cap, the
IJR, which is the Russell 600 Value, and also the Russell 2000. In addition to
that, you have the CYC in the same position. Red flags are staring you in the
face saying, “No edge for initial longs up here until we see more of a
pullback.”
Have a good trading day.

Five-minute chart of
Monday’s SPX with 8-, 20-,
60- and 260-period
EMAs

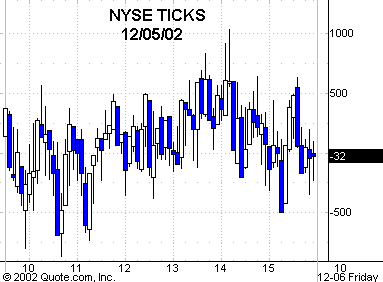
Five-minute chart of
Monday’s NYSE TICKS
