How To Find Stocks With Intraday Momentum In A ‘Momentumless’ Market
The trend is
your friend. I have traded it, used it and coaxed profits from it. To
the charge of being a trend-following moron, in the words of my friend
Dave Landry: “I plead guilty.” However, what does a daytrader do when
the market is suffering through a day that can’t seem to find a trend, and chops
around? Following the trend is great, but people — long before I was around —
figured out the market only trended around 60% of the time (30% up and 30%
down). What do we do for the other 40%? Sit out? I suppose that could be an
option, but why would you want to sit out when there are ways to pull money out
of markets like these, if you know what to look for? In this lesson I will show
you the systematic plan of attack that I use for finding these hidden gems when
the market is lacking momentum.
Being “Where
the Action Is”
For a daytrader, this is always of
paramount importance, but it becomes even greater when a choppy day comes up.
Many who have read prior lessons from me know I like to look at stocks with a 3-month
relative strength ranking of 80-99 for long side candidates and a 3-month
relative strength ranking of 1-20 for possible short issues from the
TradingMarkets.com Stock Scanner. But on days that can’t seem to decide where
they want to go, intraday relative strength or weakness is more
important. Why is a stock up 2 or 2 1/2 points, when the market slowly
grinds? It could be on news, could be due to an analyst upgrade, etc. It does
not really matter why. The fact that it is moving higher or lower while the
market is undecided is telling you something.
How Do You Spot
These Rockets When They Launch?
The
TradingMarkets.com Nightly Daytraders Report
Every night, a new feature on the
TradingMarkets.com site hands you names with the potential for continuation to
both the long and short side. It is our new Nightly
Daytraders Report, and it is full of stocks that could prove fruitful the
following morning. In it, we rank stocks with high short-term relative strength
that closed in the top of their range, suggesting follow-through over the next
one to three trading days, as well as equities with weak short-term RS that
could continue to the downside. In addition, we point out stocks with high RS
that showed a last-hour surge in volume, as well as stocks ending the session in
Slim Jims that could develop into another trade the following day.
What this gives you as a trader is a
powerful list for you took look at, when you sit down at your trading desk the
following morning. While certainly not all these names follow through, this
gives you an important heads-up as to who the leaders and laggards may be, when
the momentum awakes from the doldrums.
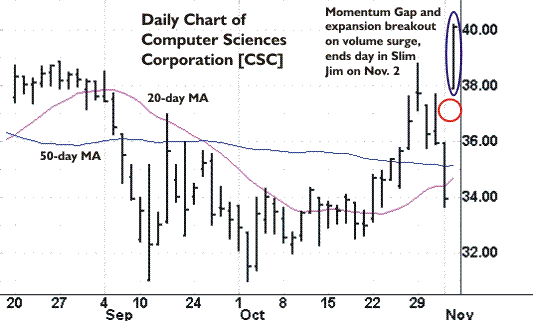
Here, Computer
Sciences Corp.
(
CSC |
Quote |
Chart |
News |
PowerRating) appears on the list, as it has a three-month
RS rating of 84 on Nov.
2, ends the day in a Slim Jim and exhibits an expansion breakout on a surge
of more than 500% of the average daily volume. The following trading session,
the stock explodes to the upside — giving the daytrader an explosive,
profitable move.
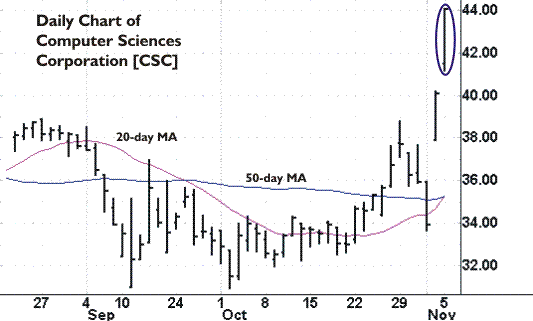
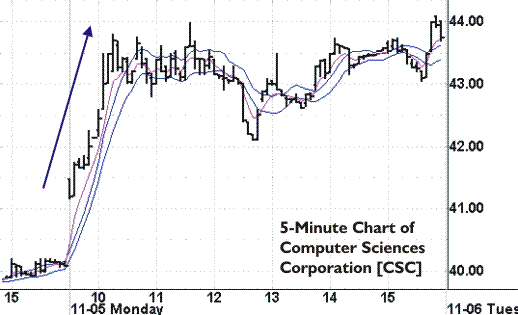
CSC runs up more than 2
1/2 points right from the get go, after another momentum gap higher.
Another example from the
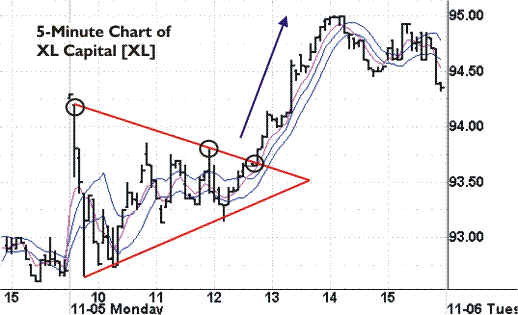
Nov. 2 list, XL Capital
(
XL |
Quote |
Chart |
News |
PowerRating), makes the
cut by holding a three-month RS of 87 and closing in the top of its range.
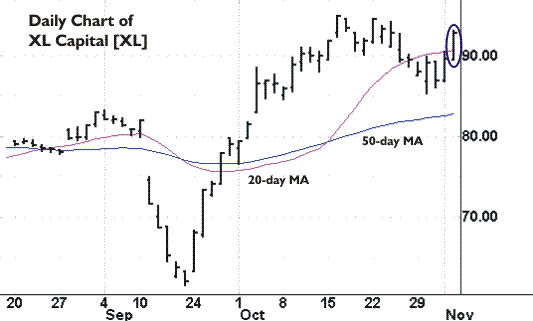
The stock gaps up in the
following session, but then proceeds to head straight down. However, it then
rallies over an angular triple top/triangle and runs up 1 1/2 points to its
intraday high.
The stocks from this list
do not always move right away, but if you have the patience and the focus to
monitor them throughout the day, you will be ahead of the game when they decide
to make their move.
TradingMarkets.com
Market Bias Indicators
Another tool that can
help you gain an edge in markets with unsure or undecided chart bias is the Market
Bias Indicators. Here you will find VIX reversal signals I, II, III, V and
VI, the McClellan Oscillator, TRIN Thrust, CHADTP and the TradingMarkets.com Proprietary
Momentum Index Indicator. These signals are updated nightly and give you a good
indication as to the probable slant to next day’s trading. These indicators are
not stand-alone signals and should not be traded as such, but they do give you a
solid platform from which to approach the following day, particularly when you
get multiple signals pointing in the same direction.
Spotting
Momentum Intraday
One of the quickest ways to spot
stocks moving is to utilize the point gainers and point losers feature in your
charting package. Most charting software has this feature to alert you to the
biggest point gainers and losers, either by exchange or simply all together.
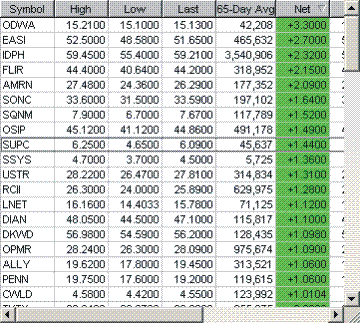
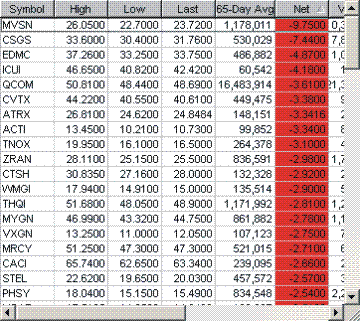
(Biggest point
gainer and loser quote windows. Courtesy of Quote.com)
These windows will show
you what is moving up or down, immediately. From here, you simply go to the
charts and see if a particular stock is setting up for a likely entry.
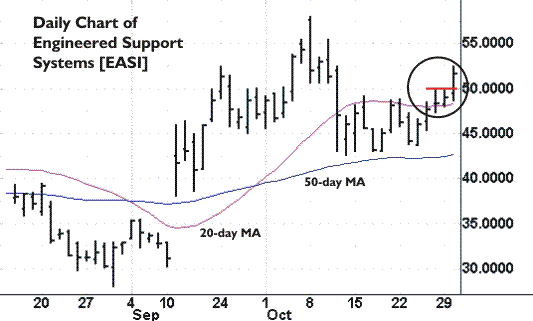
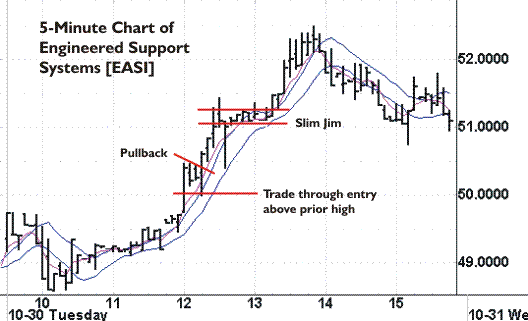
Here, Engineered
Support Systems
(
EASI |
Quote |
Chart |
News |
PowerRating), is showing three consecutive higher
closes on the daily chart when it appears in the quote window on Oct. 30 and
gives the daytrader three potential entries — trade through above the prior
high, a pullback and a Slim Jim.
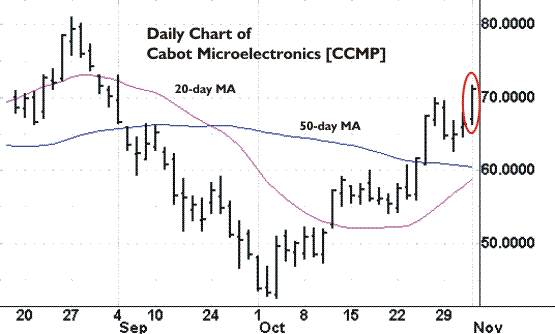
Cabot
Microelectronics
(
CCMP |
Quote |
Chart |
News |
PowerRating) is
another big mover that appears in the quote window on Nov 1.
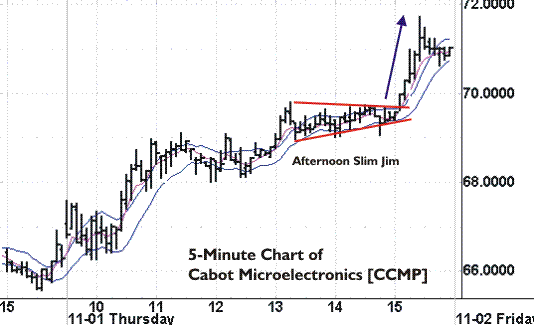
The Nasdaq
Composite
(
$COMPX |
Quote |
Chart |
News |
PowerRating) is choppy and undecided early, then rallies
upward for a solid trend day. This gives the impetus to push CCMP higher out of
its late-afternoon Slim Jim.
Not
For The Faint Of Heart
It must be said this
method is not without risk, and any of these methods utilized should be in
conjunction with tight stop-loss protection. The position should move in your
favor almost immediately. If it does not, get out. When trading in a choppy
environment, flexibility is the key. You will get stopped out of some positions
and be forced to re-enter, sometimes in the other direction.
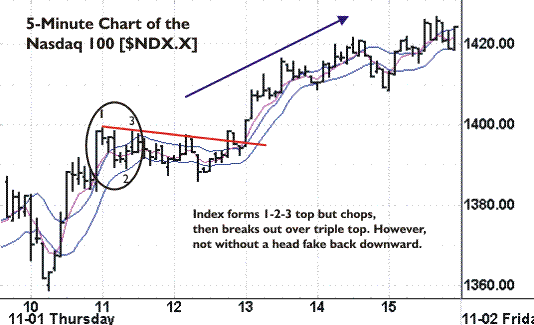
Here the Nasdaq
100
(
$NDX.X |
Quote |
Chart |
News |
PowerRating) can’t decide which way it wants to go. It forms a
Haggerty 1-2-3 top, yet seems to just drift sideways in a channel. About 90
minutes later, it breaks out above the channel/triple top, but not before making
one last bleed back into its range. Traders who recognize this action can profit
when the market finally gets its sea legs.
In conclusion, there is
no reason to sit on the sidelines when the indices as a whole are undecided
about where they want to go. If you do your homework, prepare yourself the night
before, have a plan when you sit down at your desk in the morning, and focus on
where the action is during the day, you are on your way to being successful.
When you know where to look, you can uncover stocks moving up and down on any
day. With proper money management, you lessen risk while increasing your equity
curve on a difficult day.
For The Best Trading
Books, Video Courses and Software To Improve Your Trading
