An arbitrage trade between energy stocks and futures
With a lesson
costing $6 billion, Amaranth has taught us an, albeit disastrous, arbitrage
trading technique in energy futures: buying the March-over-April spread in
natural gas futures, and betting that it will increase in value. Unfortunately
for Amaranth and its head trader Brian Hunter, the spread decreased rather than
increased in September, resulting in a $6 billion drop in value. Many
commentators breathed a sign of relief that this has caused no widespread
disruptions in the financial market, reasoning that this is too obscure a corner
in arbitrage trading to matter. However, as we learned in the Long Term Capital
Management debacle, spreads in the financial markets often move in tandem,
especially during times of market stress. Since mid-August, I have been
following another obscure spread heading towards a 3-year low, and it may
present a profitable trading opportunity.
As oil prices go to historic highs during this past year, energy stocks have
followed a similar course. For example, front-month light sweet crude oil E-mini
contract QM reached a historic intraday high of $78.30 on July 14, while the
energy sector exchange-traded fund
(
XLE |
Quote |
Chart |
News |
PowerRating) reaches its historic intraday high
of $60.15 on May 11. Since energy companies typically own rights to oil either
above or under ground, it is reasonable that their stock prices follow the price
of oil. In technical terms, we say that energy stock price “cointegrates†with
the crude oil price, a concept pioneered by the Nobel laureates Robert Engle and
Clive Granger. To prove that they do in fact cointegrate, I ran a
Matlab cointegration
package developed at University of Toledo in Ohio on the closing prices of QM
(using a perpetual futures series) and XLE for the last 3 years. The program
determined that they cointegrate with a 95% probability. Now, what this does not
mean is that QM and XLE prices will always move up or down in a similar
percentage everyday. This also doesn’t mean that there won’t be periods of time
when the spreads between QM and XLE will go way out of sync, just as the gas
futures spread did for Amaranth. What this tells us is that with high
probability, the spread will eventually goes back to their historic average, and
then probably goes in the opposite direction for a while.
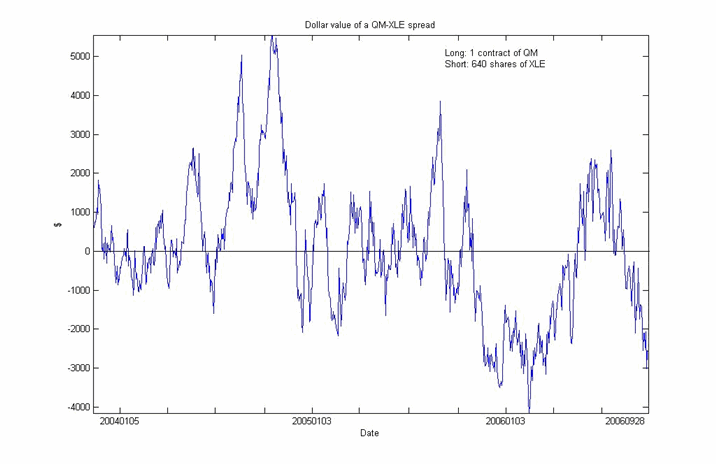
To illustrate this point, let’s take a look at a plot of the spreads between QM
and XLE over the last 3 years. Suppose we are long a front-month QM contract
(rolling over the contract every month), and are simultaneously short 640 shares
of XLE. The number of shares is determined by the Matlab package mentioned
above. The y-axis shows the dollar value of this pair of positions. We can see
that in the past 3 years, the value went as high as $5,550 on October 14th,
2004, and as low as -$4,152 on February 16th, 2006. The average is $57, which is
almost zero. As of this writing (at the close of September 28, 2006), the value
is -$2,584. While this is not near the 3-year low yet, it is getting there.
Those who have a strong stomach will buy this spread now, and hope that the
value will move back up to it long-run average of near zero.

Some people may feel uneasy about trading oil futures because they have to keep
rolling over to the next nearby contract every month, or maybe their brokerage
doesn’t allow futures trading at all. There is now a convenient alternative: an
exchange-traded fund called
(
USO |
Quote |
Chart |
News |
PowerRating). This fund trades like a stock on the
American Stock Exchange, just like XLE. USO closely reflects the value of the
nearby contracts in crude oil (with a small percentage that reflects the value
of other energy futures such as natural gas or heating oil). And yes, I have
checked that it cointegrates equally well, if not better, with XLE.
Some thoughtful readers may wonder whether there are any fundamental reason
energy stocks have dropped much less in value since the summer than energy
futures prices. Now energy companies are valued much like any other companies:
roughly speaking, their stock is worth the present value of their anticipated
future cash-flow plus their current net asset value. The current net asset value
certainly should follow the front-month crude oil contracts very closely, in
fact, more closely than their stock price. However, their anticipated future
cash-flow reflects the expected price of oil in the years to come, not the
current cash price of oil. (For those readers who enjoy a bit of exercise, they
can look up the oil contracts that expire in 2007, 2008 and beyond to see if
they in fact has higher prices than the front contract.) At this time, the stock
(and futures) market is telling us this: oil price will go back up in the
future.
Ernest Chan, Ph.D. is a quantitative trader and consultant who helps his clients
implement automated, statistical trading strategies. He can be reached through
www.epchan.com. Ernie has worked as a
quantitative researcher and trader in various investment banks (Morgan Stanley,
Credit Suisse First Boston, Maple Securities) and hedge funds (Mapleridge
Capital, Millennium Partners, MANE Fund Management) since 1996. He has a Ph.D.
in physics from Cornell University.
