Connors Research Traders Journal (Volume 44): Making Money From Behavioral Missteps Made By Others, Part 1 – “Recency Bias”
New! Our new book, The Alpha Formula; Beat The Market With Significantly Less Risk is now available at www.TradingMarkets.com/alphaformula.
The four most expensive words in the English language are ‘this time it’s different.”
– John Templeton
Recency bias is the tendency for people to more prominently recall and emphasize recent events and observations compared to events or observations further in the past. This results in people assuming the future will continue to look like the recently observed past, and act accordingly.
When one theme, such as internet companies realizing high returns in the late 1990s, commodities and emerging markets outperforming in the 2003-2007 period, or the FAANG stocks (Facebook, Apple, Amazon, Netflix, and Google) dominating the recent bull run, people tend to observe these results and assume they will continue.
This is recency bias at work. This recency bias can extend and accelerate already established trends. Recency bias is also present in short term time horizons, often taking securities up or down “too far too fast.” Learn about recency bias – and how it can be used to profit in the markets!
Tech Bubble – “This Time is Different”
During the tech bubble of the late 1990s, many market participants took the position that the internet fundamentally changed the economy and that “this time is different.”
The prevailing narrative was that companies that thrived in the “old” pre-internet, economy were not going to do well in this new economic reality. Any company that was perceived to use the internet and be a part of the “new” economy was bid up relentlessly, even if they made no money and didn’t project to make any money in the near future.
This time period resulted in some truly amazing statistics.
For instance, according to the paper “Some Factoids About the 2001 IPO Market” from Jay Ritter of the University of Florida, of the 446 IPOs that took place in 1999, many of which were of new internet companies, the AVERAGE first-day return of these IPOs was 70.89%! That’s right, 70.89% in one day!
How could this be?
How could the investment bankers and other stakeholders get the initial valuation so wrong that the average one day return for these stocks what over 70%?
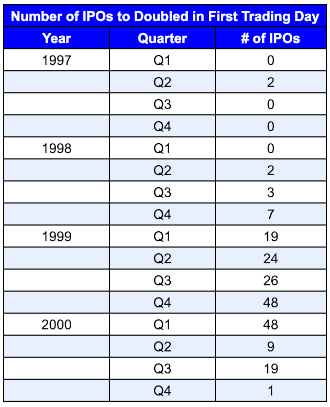
To further illustrate the euphoria of the time, the following table displays the number of IPOs to double in price on their first day of trading, again according to the same paper. Doubling in price during a firm’s first 24 hours as a public company is rather ridiculous if you think about it, but that is in fact what happened to many of these firms during this euphoric time.
Notice the spike in first day doubles around the 1999 – early 2000 period, when the mania was it its high. Recency bias caused many investors to observe this performance and assume future IPOs could have similar results, causing them to herd into recent tech IPOs, which further feed into the mania.
This view, that there has been a fundamental shift in the economy and that the old rules should be thrown out the door, was confirmed by the performance as the tech-heavy Nasdaq increased at a dramatic and unsustainable rate.
This is recency bias in action. Investors observed the doubling of tech IPOs and the general outperformance of internet stocks and herded in, assuming the near future will look like the recent past. This served to extend the bubble dramatically and resulted in the amazing statistics we have just witnessed.
Recency Bias (Recent Performance) Drives Many Investors Fund Choices
Recency bias can easily be seen in the way many investors pick funds to invest in. The process many investors take when reviewing funds for potential investment is usually just looking at one year or three-year returns and going with the funds with the best performance (performance chasing).
This ignores the oftentimes long-term cyclical nature of asset class or fund returns, with many investors jumping in the hot sector or style just as longer-term mean reversion begins to take hold, thus making the investor underperform going forward. Observing the outperformance of the recent past and using that information to pick funds (thus assuming the outperformance will continue) is a clear case of recency bias.
Recency Bias in Volatility – 2017 vs 2018
A very recent example of recency bias can be seen in the volatility regimes of 2017 vs 2018, and the subsequent media reaction.
To put it mildly, these two years were very different. 2017 was frankly abnormal, with realized volatility coming in at its lowest level in half a century.
When equity volatility returned to more normal levels in 2018, many market participants, influenced by the recency effect of a low volatility 2017, viewed 2018 as an extremely volatile year. The media also proclaimed that 2018 was a year of high volatility, no doubt comparing it (consciously or subconscious) to a low volatility 2017.
These proclamations are largely driven by the recency effect, as market volatility in 2018 was compared with 2017. Taking a step back and looking at the numbers revealed that 2018 was “normal” compared to history and it was 2017 that was abnormal.
To take a look at this, we will use the VIX (30-day implied volatility of the S&P 500), the most ubiquitous volatility measure in the market today.
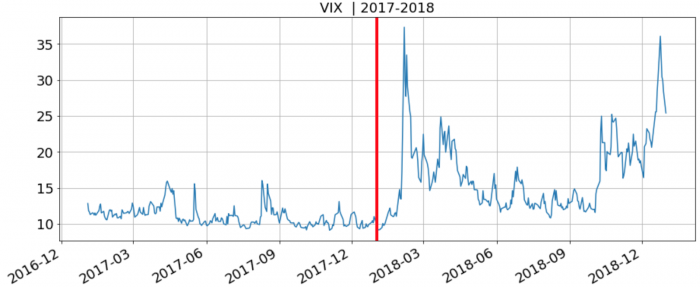
Below is a chart of the VIX in 2017 and 2018, with a vertical line separating the years. Notice the large change in behavior from one year to the next, causing many market participants and commentators proclaiming that 2018 was an abnormally volatile year:
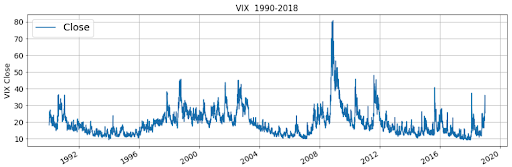
Extending the history further, however, makes 2018 look much more normal.
Notice that volatility levels seen in 2018 were witnessed many times in the past, and in fact much higher as well.
To illustrate this point further, we took two central tendencies, mean and median, for VIX values per year. What stands out in the breakdown below is just how abnormal 2017 was, despite the media narrative that 2018 was the abnormal “high volatility” year:
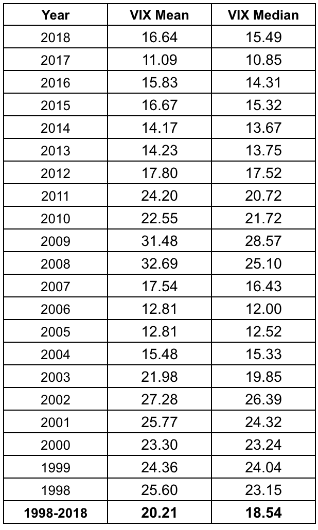
Notice that the mean and median VIX levels for 2018 were actually LOWER (less volatile) than the mean and median VIX levels over the last 20 years! Looking that the numbers, 2017 is what stands out as an outlier, with volatility levels well below longer-term averages. 2018 was just a return to more “normal” volatility levels historically.
You wouldn’t know this by listening to market pundits throughout 2018, as the recency bias of a low volatility 2017 made 2018 seem more volatile than it was in comparison.
Implications for Market Behavior – Why You Care
Recency bias can affect market prices in several ways, including:
- Supporting a continuation of the prevailing trend. Recency bias causes investors to assume that the prevailing trend will continue, as they extrapolate the recent past to the near future. As such, they pile into (or out of) investments causing the existing trends to continue and often times accelerate.
- Recency bias can also lead to an overreaction in the short-term. Traders with shorter time horizons are just as susceptible to recency bias. As such, they often observe a large short-term price move and jump on the move. This causes securities to often move “too far, too fast”, presenting a mean reversion trading opportunity.
Understanding behavioral biases such as recency bias can make us better traders. We can use this observation to construct trading and investment strategies that look to take advantage of these biases.
We’ll continue to expand on this in upcoming issues of the Connors Research Traders Journal.
New Book!
We’re excited to announce the release of our new investment book.
- The book, “The Alpha Formula; Beat The Market With Significantly Less Risk” combines…
Hedge fund legend Ray Dalio’s brilliant insight into combining uncorrelated strategies… - With new, minimally correlated, quantified, systematic strategies to trade when markets go up, when markets go down, and when markets go through times of stress.
All combined, you will gain access to a systematic portfolio which has significantly outperformed the market.
Highlights include…
- Higher Returns
- Higher Sharpe Ratio
- Significantly Less Volatility
- 80% Lower Drawdowns!
- Near Zero Beta
- Alpha of over 9%
The index fund industry claims that active money management doesn’t work. They also claim Alpha doesn’t exist. This book proves them wrong!
If you are looking for new research, new quantified strategies, and numerous ways to enhance your portfolio’s returns, “The Alpha Formula” is a book you’ll want to read over and over again.
For more details on “The Alpha Formula”, please click here now.
Chris Cain, CMT, and Larry Connors