Connors Research Traders Journal (Volume 51): Lower Your Risk With Trend Following… Here’s How
How would you like to apply a simple rule which significantly reduces the risk of your portfolio?
Background
Trend following is one of the oldest and certainly one of the most successful investment strategies in history.
Sometimes called “time series” or “absolute” momentum, trend following uses a securities own past performance to dictate positioning, looking to go long securities that have gone up in the recent past and be out of (or short) securities that have gone down in the recent past.
A trend follower looks to be “in sync” with the market, and continually puts themselves on the right side of the trend.
Real-World Results
Trend following has decades of real-world results behind it and is one of the most widely studied phenomena in modern finance. Academic research has clearly shown what practitioners have known for years – that markets tend to trend and that following such trends can be a profitable strategy.
A Closer Look at the Effect of Trend Following Rules
What is a typical result of applying straightforward trend-following rules to individual assets? Based on our research, we can conclude that:
Trend following at times results in higher returns, but it consistently results in lower risk.
As such, we view trend-following as a risk-reducing strategy as opposed to a return enhancing strategy, at least on a stand-alone basis. This is an often-overlooked characteristic of trend following. This risk-reducing effect of simple trend-following rules, in our opinion, is the most attractive characteristic of the strategy. You will see this play out in the numbers ahead.
Trend Following Test
To demonstrate the risk-reducing nature of trend following, we will conduct a simple test using US sector ETFs. Our test runs from January 2003 to the end of 2018.
We will show you buy and hold performance of each ETF, then apply a simple trend-following rule to each, displaying the risk-reducing nature of trend following.
Below are the ETFs we will use in this study.

The following table displays results for buying and holding each ETF from January 2003 to December 2018:
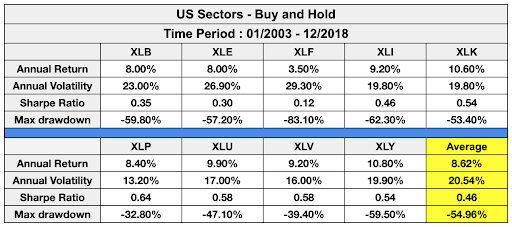
While the results per sector naturally vary, they all had pretty steep drawdowns at one point or another. The max drawdown for each sector ranged from -32.8% for Consumer Staples (XLP) to a shocking -83.10% for Financials (XLF).
Looking at averages across the sectors, you’ll see an average return of 8.62% per year with 20.54% volatility, a Sharpe ratio of 0.46 and a max drawdown of -54.96%.
Now let’s apply a simple trend-following rule to each ETF individually and observe the results. For our unoptimized trend following measure, we will look at total returns over the past 6 months (126 trading days).
The rules are:
- If the trailing 6 month total return is greater than 0, buy and hold that ETF
- If the trailing 6 month total return is less than 0, buy and hold SHY (1-3 year US Treasuries)
- Rules are checked once a month, at the end of the month
The following table displays the results of this simple trend-following strategy applied to each US sector ETF.
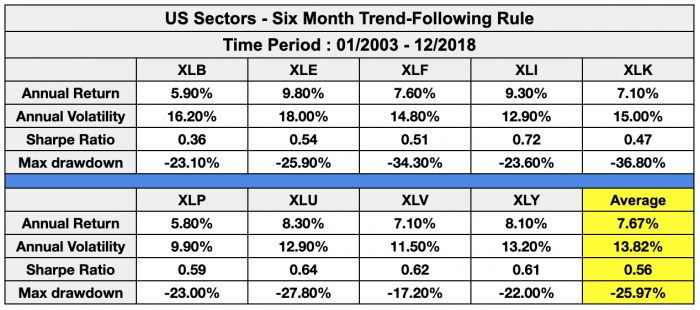
Averaging the returns shows an annual return of 7.67%, slightly lower than the buy and hold returns.
What is very clear, however, is that applying simple trend-following rules consistently decreases risk. You’ll see significant risk reduction in every sector, with our simple trend-following rule decreasing volatility and max drawdowns in every case.
Again taking a look at the averages, we saw a marked decrease in volatility, with average volatility for our trend following strategy decreasing to 13.82% vs 20.54% for buy and hold. This reduction in volatility results in increased Sharpe ratios, taking the average Sharpe from 0.46 (buy and hold) to 0.56 (trend following).
Furthermore, the average max drawdown, another risk metric, decreased dramatically. The average max drawdown for buy and hold came in at -54.96% and was decreased by over half to -25.97% for trend following!
A 25% drawdown vs over a 50% drawdown is significant! This is the power of trend following.
Let’s now take a closer look at the risk comparisons of buy and hold vs trend following. The ensuing table compared the volatility and max drawdown of each sector vs trend following. Notice the consistent risk reduction here:
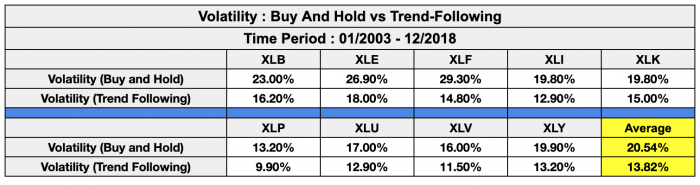

Notice that trend following decreased volatility and decreased max drawdown in every case, often by a significant margin.
Conclusion:
This simple study is not intended to be a stand-alone trading strategy, but rather an illustration of the consistent risk-reducing effects of simple trend-following rules.
In our study, simple trend following rules decreased the volatility and max drawdown of each of the nine US Sector ETFs. This is the main benefit of applying trend-following rules.
We go much deeper on this topic and how to apply this to your trading is our new book “The Alpha Formula”. If you’d like to order the book you can do so by clicking here.
More Knowledge From Connors Research To Improve Your Trading
1. Programming In Python For Traders Webinar
Become a Stronger and Smarter Trader in Only 5 Weeks!
The majority of the professional trading desks around the world are requiring their traders to create and test their strategies using Python (not Amibroker and TradeStation). They’re doing this because Python allows their traders to build better strategies faster and more efficiently with the objective of increasing profits.
If you would like to learn more about how you can join the tens of thousands of professional traders now using Python, please listen to this 30-minute webinar we have just conducted.
This webinar discusses how and why Python will improve your trading. It also discusses our upcoming Programming in Python for Traders course and how you can be a part of it.
This is the third time we’re offering the course and it’s already the largest class to date with many professional traders registering for the course.
We also guarantee your programming success with a full money-back guarantee – you’ll be programming in Python within 6 hours or you receive a full refund.
The passive investment industry states there is no Alpha in the markets. This book proves them wrong!
The Alpha Formula – High Powered Strategies to Beat The Market With Less Risk teaches you strategies and portfolios with historical Alpha in Stocks, ETFs and Fixed Income.
Backed by dozens of academic studies and combining behavioral finance with Ray Dalio’s correlation research, this book will teach you new, easy to understand quant strategies you can apply immediately.
Larry Connors and Chris Cain, CMT
P.S. – Receive Trading and Investing Research from Connors Research! To subscribe to The Connors Research Traders Journal, please click here.
Share with a friend.