How to Use Backspreads in Options Trading
I’m a big proponent of using the right tool for the job. The backspread is an amazing little strategy when you expect a potentially big price move, but at the same time you realize that there is a chance you could be wrong and no move whatsoever develops. Since it is a directional strategy that costs nothing if you’re wrong, it is perfect for times when you are bottom fishing because you think it is the end of a market sell-off.
A backspread is constructed by shorting a near-the-money options and buying a larger quantity of options of the same type (calls or puts) at a farther out-of-the-money strike. A 2×1 ratio is most common. Normally you try to select the options in such a way that the options you’re shorting bring in a sufficient credit to cover the cost of the options you’re buying, resulting in a net cash flow of nearly zero, or even a net credit to your account.
Since you are net long options in a backspread, the profit potential is unlimited. At the same time, the sale of a smaller number of more expensive options effectively “pays for” the options purchased. So if both legs of the backspread expire worthless, it costs you nothing. The short leg of the backspread also makes time decay less of a worry.
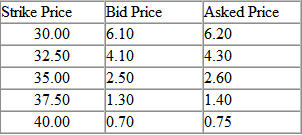
If all that sounds too good to be true, I’ll tell you what the catch is. There is a price zone where the backspread loses money. It occurs when the underlying moves in the desired direction by only a small amount. Let’s look at a generic example using a stock we will call XYZ Corp, currently trading at $35 a share. The January call options, having 108 days until expiration, are available at the following bid and asked prices:
Selling the ATM call option and buying 2 OTM call options at the next higher strike results in the following trade:
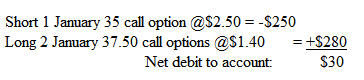
While this trade results in a debit of $30, this particular 2×1 backspread will actually cost $280 to put on. The cost of a backspread arises from the collateral requirement for a 1×1 credit spread, plus the cost of the extra call purchased. Below is the risk graph for this position.
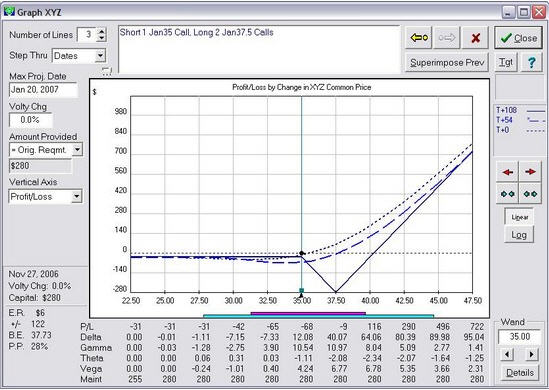
At expiration, below the current price of $35 the most you can lose is the original debit of $30. And the trade begins to quickly make money once the stock price rises above $40. But note that this position loses money if XYZ Corp is in a range from $35 to $40 – the “dead zone”. However, it is difficult to lose all your money, as the stock would have to finish precisely at $37.50 (the long leg’s strike price) on expiration day to lose the full $280 that your brokerage requires you to hold. Contrast this with simple option buying – where it is very easy to lose all your money!
Noteworthy is the outstanding risk/reward characteristic of the selected T+54 line (the dashed line), representing the halfway point in the life of this position. If the expected rally happens within this time frame, you’re golden. If not, you may consider closing the position at this time for just a small loss. Assuming that implied volatility does not drop the most you could lose in 54 days is $68.
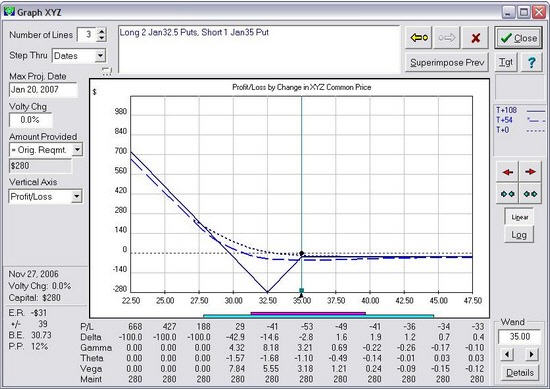
Note that if you are bearish, backspreads can be constructed using puts instead of calls. Put backspreads behave in a mirror image fashion to call backspreads:
While this trade results in a debit of $30, this particular 2×1 backspread will actually cost $280 to put on. The cost of a backspread arises from the collateral requirement for a 1×1 credit spread, plus the cost of the extra call purchased. Below is the risk graph for this position.
Len Yates is the President and founder of OptionVue Systems International and has earned worldwide recognition for his groundbreaking work in options analysis software. He has published numerous books and articles on options analysis and trading strategies, and is a primary contributor for the educational site DiscoverOptions.com.