NZD/USD Staging a Legitimate Reversal
As the USD had its way with all the G7 countries over the last two weeks, there was one pair that fought back ahead of the crowd. One of my favorite anti-podean pairs, the kiwi – is showing signs of posting the healthiest reversal attempt on the board. One of the things which has really put this on display is ichimoku models which have given a unique insight into this move.
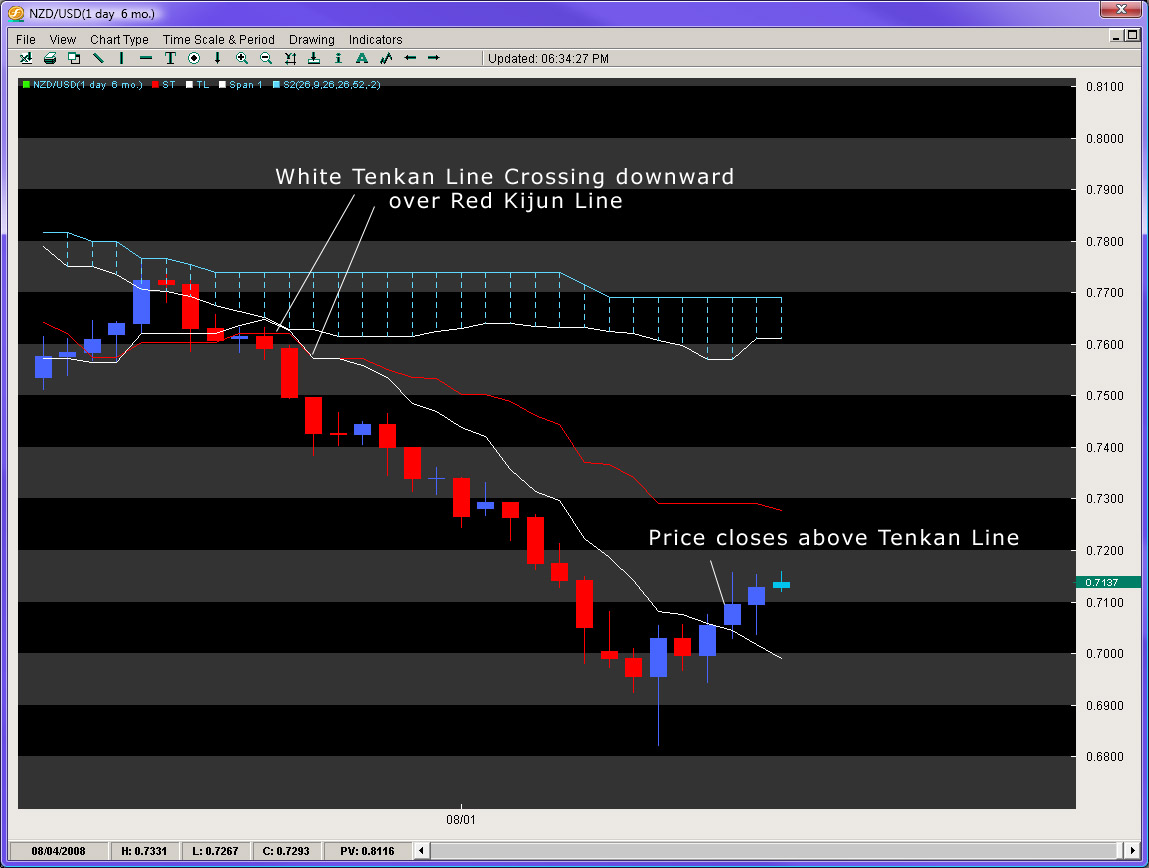
First, using ichimoku analysis, let’s take a look at the daily charts on the pair. The kiwi had a strong ichimoku sell signal trigger on the 24th of July, nicely below the cloud (blue shading) with the tenkan line (white) crossing over the kijun line (red) right around .7500. A strong crossover is one of the most powerful signals you could get using ichimoku models, and it followed it up 11 out of 15 days of selling and a decline of approximately 7 cents before it started to bounce off the lows.

During that time, it drifted away from the tenkan line, which is a 9 period EMA, but on the 18th of August, produced its first daily close above it. Ichimoku clouds are designed for trending type moves, and when you have a trend that spent over 20 days below the tenkan line and then produces its first close above the tenkan line, this is a good initial warning signal the trend may be coming to an end for the moment. Since then, it has produced a 2nd close above it and today’s price action is set to also close above it. This further bolsters the case for a legitimate reversal, besides the fact that it has bounced 300 pips off the lows.
More importantly, it was the first pair to close on the other side of the tenkan line of any of the G7 countries. The only other pair to achieve this is the USD/CAD, and it’s only done it on today’s candle which is still open. The rest are far away and thus gives us more evidence the kiwi is leading the pack.
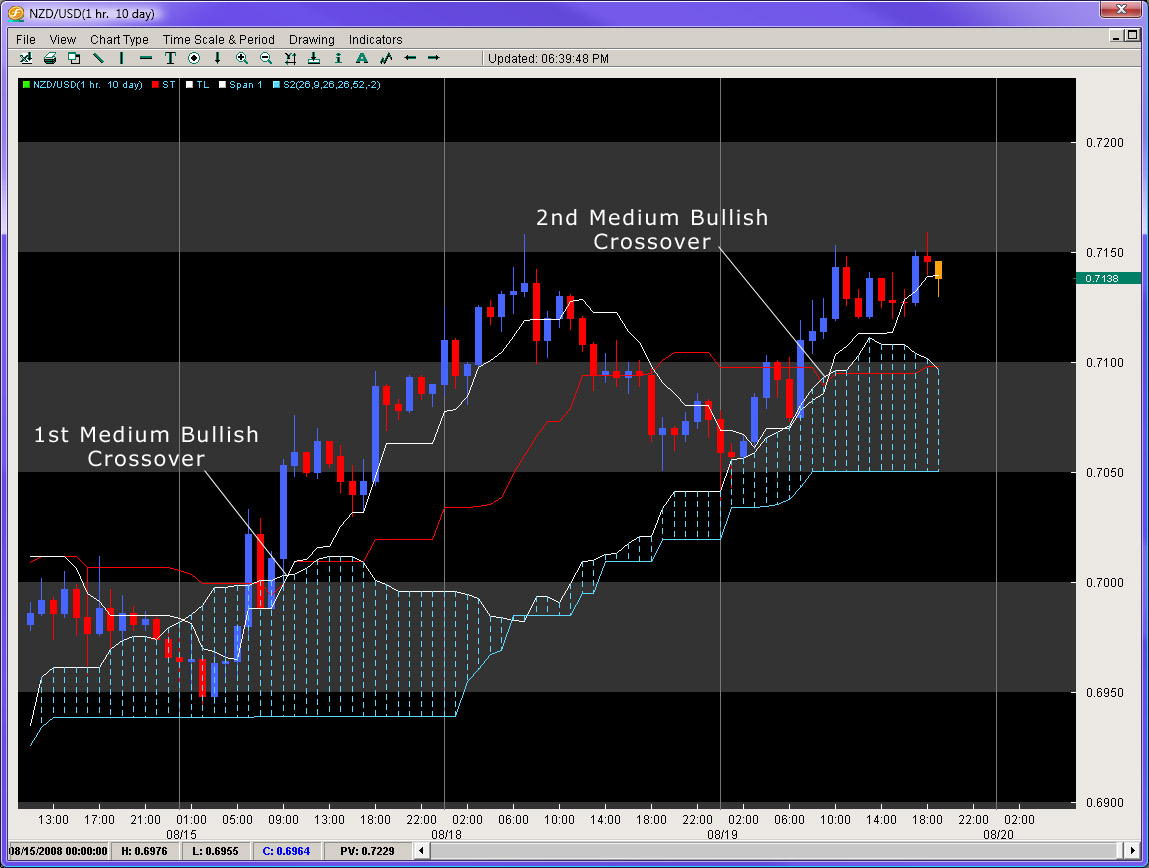
Another interesting point to be taken is looking at the ichimoku on the intraday charts. Looking at a 1H time frame, it is also the first of the G7 pairs to produce a medium or strong buy signal on this lower important time frame since bouncing. A medium buy signal occurs when the tenkan line crosses upward over the kijun line (very much like a MACD) but it has to do so inside the cloud or ‘Kumo’. A strong buy signal occurs when the crossover happens above the cloud.

While every other G7 pairs were producing weak buy and sell signals (weak buy is over below the cloud/weak sell is over above the cloud) all over the place, the kiwi was showing greater signs of resilience and produced a medium buy signal on the 15th as illustrated by the chart and another one earlier today around 9 a.m. PST. This suggests that of all the majors out there, the kiwi is not only putting up the most legitimate reversal, but is leading the pack.
Chris Capre is the Founder of Second Skies LLC which specializes in Trading Systems, Private Mentoring and Advisory services. He has worked for one of the largest retail brokers in the FX market (FXCM) and is now the Fund Manager for White Knight Investments (www.whiteknightfxi.com/index.html). For more information about his services or his company, visit www.2ndskies.com.
