Recognizing When Not To Trade
Yesterday’s action
was similar to most of the other sessions: little range intraday combined with
choppy price action. While I did not
trade yesterday (touch of a cold), a quick look at the charts indicated I did
not miss too much, with the exception of the nice selloff just after 10 a.m. ET. With that
being said, it makes
an ideal situation to write today’s column on recognizing when not to
trade.
As most of you know,
it is certainly easier to know how the market is trading by actually being in
the heat of battle. A few winning or losing trades will usually be a good barometer as to
whether to continue trading
or not. But what do you do when you
come in late, or are returning from lunch?
Simple, look at the charts, the one-minute, to be specific.
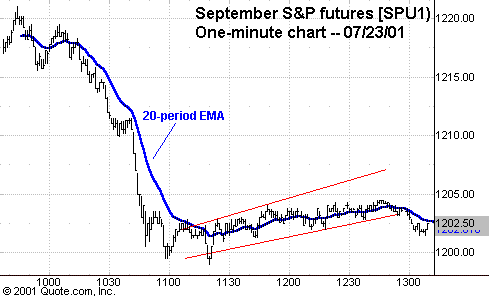
Chart 1 is a
one-minute S&P futures chart showing midday action (inaction).
As indicated in the channel bands, most of the moves were less than 3
points. Hardly enough to optimize
entry and exit points. Typically,
during this price action, a trader will end up scratching most of the trades and
get eaten up in transaction costs. Remember,
unless trading action is very heavy midday due to news, etc., you are playing
against the specialist or market maker, and you know who will win that game.

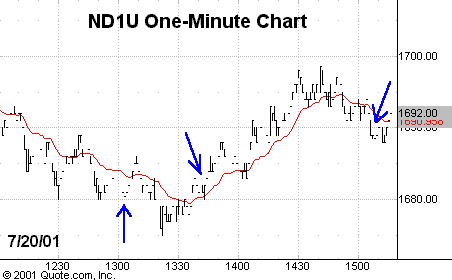
Chart 2, is an
excellent example of the dreaded “Hash Mark†chart.
Chart 2 shows the closing price action of the Nasdaq futures on Friday
afternoon. Those of you who traded
/ observed on Friday afternoon knew that it was a complete waste of time.
Whenever you see a chart with several “hash marks†representing a
one-minute bar, don’t trade. With a hash mark bar, you
get one price traded for a whole minute. The
risk / reward here is terrible.

Looking ahead to
today’s session, the futures are trading right around yesterday’s close.
The S&Ps are trading just above key support at 1188, other intraday numbers to look for are: 1182 and on the upside 1201.5 and 1206.
The Nasdaq managed a close below 1679, which should now serve as intraday resistance. The next area
of support I see is around 1640 and 1616.
Given how
temperamental this market has been about breaking out of this trading range,
don’t get too carried away on playing any breakdowns yet.
If the indices manage to hold below these technical levels however, we
should be able to effectively sell-short most intraday rallies.
In terms of some key
numbers on good trading stocks, look for 102 on IBM
(
IBM |
Quote |
Chart |
News |
PowerRating), which was the
low put in after the earnings last week. Morgan
Stanley
(
MWD |
Quote |
Chart |
News |
PowerRating) at 56 may see support, Goldman Sachs
(
GS |
Quote |
Chart |
News |
PowerRating) may re-test
80. Also keep an eye on the bank
stocks if the market does sell off. Stocks
like Bank of America
(
BAC |
Quote |
Chart |
News |
PowerRating) and Citigroup
(
C |
Quote |
Chart |
News |
PowerRating) were beneficiaries of
the weak market, probably on the assumption that it would induce further rate
cuts.
I will be in TradersWire
Interactive this morning, sharing my observations. Have
a good day trading and remember to always keep the probabilities in your favor.
Please e-mail me your questions and
comments.
