Toni Hansen Teaches You a New Way to Time Market Reversals
Over the years, a number of different tools have been developed or utilized
to analyze price action in the market and guide traders and investors alike in
their decision on when to buy or sell a particular security. Some of these tools
are extremely complex, while others are too general to be useful. One of the
mainstays for any market participant relying on technical analysis, however, is
the importance of being able to identify and apply basic support and/or
resistance levels. These are price levels in a security, or the market as a
whole, where the current price trend is likely to stall or reverse.
Support/resistance levels have been used for centuries and, once understood,
they can be applied to any marketplace, whether its securities, forex, e-minis,
etc.
There are dozens, and perhaps even more, types of support/resistance
configurations employed by market professionals. In my experience, however, none
are more potent than pure price levels. Most indicators, such as moving
averages, are based upon mathematical equations which factor in price action. If
a person understands how to read the price levels themselves, s/he is less
likely to rely on other crutches to recognize shifts in price action.
Within the category of price support/resistance itself exist a number of
different forms of support/resistance. The ones which I will discuss in this
piece include whole number support/resistance, prior pivot highs and/or lows,
prior congestion zones or trading ranges, equal or measured moves, and gap
levels.
What are Support/Resistance Levels?
In a discussion of what exactly a support or resistance level is, consider
support to be like a floor in a high rise and resistance as a ceiling. Support
levels can break lower, but eventually when solid ground is hit, it cannot be
penetrated. Yes, I know, we can bring out the digging equipment, but just like
it becomes more and more difficult to dig deeper in the ground, it also becomes
more difficult for security prices to push lower once they drop into they penny
stock category. Resistance, on the other hand, can be
broken higher, but most securities also run into trouble when they get too
extended on the upside and the air becomes rather thin.
When thinking of support/resistance levels, it is very common for most people
to think of them in terms of absolute price levels. For instance, if they are
looking at $50 as a resistance level, they mean exactly $50. On the other hand,
if they are looking at moving averages as a support level, they will check to
see what the exact price of the moving average is, such as $50.78.
In reality, support/resistance levels are not exact prices, but rather price
zones. So, if the resistance level is $50, then it is actually the zone around
that $50 level that is the resistance. A stock, for instance, may hit only
$49.87 or it may hit $50.25 and still hold the $50 as price resistance.
The main factor in determining exactly how much the exact prices are tested
by is how quickly or slowly the prices move into that resistance zone. For
instance, if the zone hits very quickly on a large momentum surge, then it is
more likely to hit that $50.25 level. This is also the case if the stock is a
rather volatile one with a wide price range intraday. If the security spikes
higher and does not quite hit the price resistance, such as a spike into $49.70,
then it may round off into $50 with slightly higher highs and never exactly
touch the $50 price resistance zone before turning over due to the slowdown in
momentum into that resistance. The larger the time frame, the greater the price
zone is as well. A resistance zone at $50 on a weekly time frame may have a
range of $1 on each side of $50. Where traders tend to run into trouble is in
thinking that because the stock has traded over $50 by more than just 10 cents
that the $50 has broken, so we often hear of people “buying the highs” in such a
case.
Whole Number Support/Resistance
The first type of support/resistance I am going to introduce is one that is
likely very familiar: whole number support/resistance. Whole number support/
resistance refer to the price levels most of us have in our head right away when
we think of support and resistance. They are levels such 14,000 in the Dow Jones
Industrial Average. CNBC does not get excited by the Dow hitting 13,884. No, it
is when it pushed above 14,000 and then when it closed 14,000 that it really
made headlines. When a security, or the market overall moves into these larger
price levels, rounded to either the dollar in most stocks, or the 10s, 100s,
etc., people tend to react the most. It’s second nature. My third grader has
just spent several weeks in school earlier this year learning how to average and
to round up or down. It is something that has been ingrained in us since
childhood!
In Figure 1 below is a recent chart of the Dow. Even though the Dow
technically broke 14,000 in terms of the exact price, when we think of the Dow
in terms of a larger time frame move, we have yet to see the 14,000 zone
penetrated. At 14,198.10, the Dow was STILL at the 14,000 price resistance zone.

To futures traders, a primary price support/resistance noticeable in the NQ
is its tendency to gravitate to levels broken into 5 point increments. Examples
are 1850, 1845, etc. If the volatility is high and the intraday range wide, then
the 10 point levels, such as 1850, 1840, or 1830 will hold better. In the YM the
10 point increments, and particularly the 100 point levels catch people’s
attention and reversals or consolidations tend to form at those zones. In the
chart of the Dow Jones Ind. Average (Figure 1) we can see how it often moves
towards those 100 point increments as well. Many of the places it stalls at are
almost exactly at a 100 point price level. This included the all-time highs
which were within just a few ticks of 14,200. The greater degree to which a
price is rounded, the stronger that price zone is. Rounding to 1,000 as the
greatest, 100 next, 10s, then 5s. In smaller securities a trader can even round
to the 50 cent level.
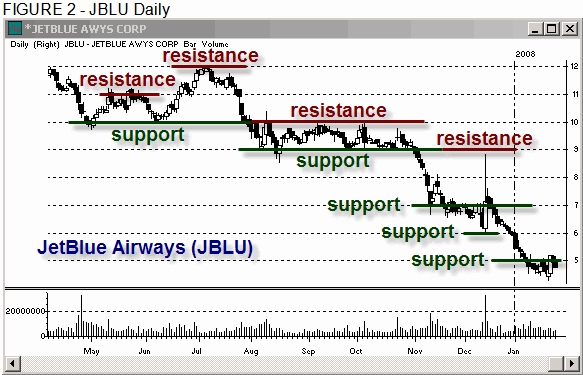
Figure 2 displays another example of price support/resistance. This time it
is in a security most traders have all heard of: JetBlue Airways
(
JBLU |
Quote |
Chart |
News |
PowerRating). It is
very common for prices to swing back and forth between whole number levels.
Often they push through the exact whole number a bit more the first time it hits
and then to a lesser degree on continued testing of those levels. An example of
this took place in the summer of 2007. At the start of May, JBLU hit the $10.00
price support zone with an exact low of $9.72. A second test of that same zone,
in early June, scored a low of $10.05. In both cases, those lows were a part of
the $10 support zone.
Before a congestion zone breaks, it may not even make it back to one end of
the price range. This is what happened in October when JBLU bounced back up to
$10 for the final time before breaking lower into November. Although the prior
two tests of the highs in September and early October came within just a couple
of cents of $10, the final push higher towards the end of October only managed a
high of $9.77. This type of price development is indicative of higher odds for a
breakdown, since the previous test of the lower end of the range in the $9 zone
hit $8.97.

Pivot Levels as Support/Resistance
The second type of price support/resistance is closely tied to the first. It
deals with retests of previous pivot highs or lows. A “pivot” is simply a level
where prices reverse. They tend to look like the letter “V” or an upside down
“V”. When they occur within a congestion zone, it may be necessary to drop down
to a smaller time frame to be able to identify them well. Sometimes these price
pivots correspond to whole number support/resistance. Sometimes they do not.
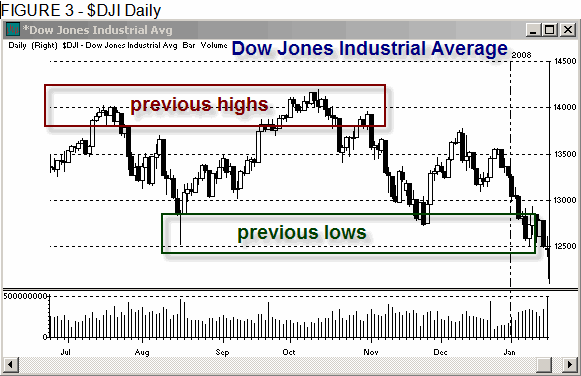
In the example of the Dow which we looked at earlier, it does correspond to
the whole number support/resistance levels. This is shown in Figure 3. Look at
the 14,000 level. This hit in July for the first time and then retraced back
into the prices from the first quarter of 2007. The Dow hit the 14,000 zone for
the second time at the end of September after coming off a sharp rally
mid-month.
Even though the second time the Dow hit the zone of 14,000, it was able to
push into nearly 14,000, the “zone” of the 14,000 high was where all the price
bars overlapped at the initial July highs. The stronger upside momentum on the
second test of the 14,000 resistance level allowed the Dow to push somewhat past
the exact high to form a slightly higher high before the momentum reversed and
led the index back into the previous lows.
Initial lows following the first test of the 14,000 level in the Dow were
established in August on extreme downside momentum. Since the pace was slower
into November on that second retracement off the 14,000 highs, it did not quite
hit the exact lows from August, but only came into the support “zone” of those
lows. The third test of the same level into January was again on stronger
momentum. This time, although it stalled at that support for several days, it
was able to punch through to break the support zone in mid-January.

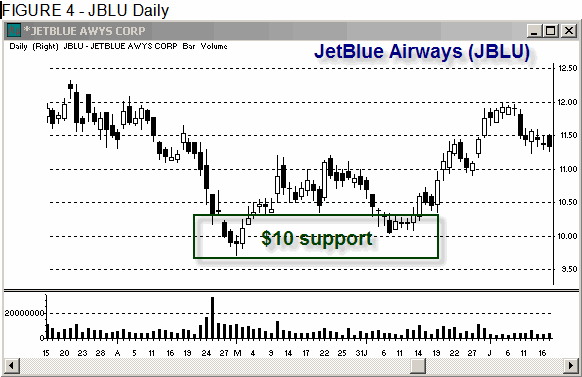
Another example of price support/resistance levels goes back to an example I
gave you in JetBlue Airways (JBLU). This involved the $10 level from early May
and early June. While $10 hit and held on the first day into the $10 level in
April, it then rolled over a bit off the lows, like the Dow did off the second
highs, and made somewhat lower lows at $9.72 before bouncing. The second time
around, that previous low served as support. Even though it did not hit that $10
support exactly the second time around, it still retested the “zone” of that
support when it returned there in June. As in the Dow, the second test of the
support/resistance was also a pivot price support/resistance in addition to the
whole number support/resistance which had held with each initial test.

Congestion Zone Support/Resistance
Whole number support/resistance can also be tied into the third type of price
support/resistance: congestion zones. When a security falls into a trading
range, congestion zone, base, coil, or whatever you wish to call it, that zone
becomes support/resistance on any retracement once it has broken out of that
zone. A breakout to the upside from a trading range, for instance, will mean
that the range itself becomes support on any retest of it. This also means that
any break lower from a range will lead to resistance if the zone from the
trading range is tested on a bounce. These trading ranges often take place
around whole numbers.
One example of a congestion zone serving as support/resistance can be seen in
Figure 5 of JBLU. I talked earlier about the $10 level as support, but before it
even dropped into $10 JBLU had been in a trading range. After breaking lower out
of that range, the range itself became resistance. It tested the very lower end
of the range in May, but it is common for a price move to push back into the
middle of a range before it continues lower in the case of a downtrend. This
took place in early July. Not only was the July test of $12 a return to the
whole number as price resistance, but it was also resistance from the middle of
that earlier congestion level.

Equal/Measured Move Support/Resistance
The fourth type of price support/resistance deals with comparing previous
price moves to current price moves. Essentially, if a price move is followed by
a congestion, such as a base, flag, etc., then as long as the congestion breaks
at about the same momentum as the move into it, it will have the strong
potential to hit an equal move level on that continuation. This equal move level
can also be called a “measured move.”
JBLU in Figure 6 displays two examples of a measured move. The first involved
the comparison of April’s breakdown from the March to early April congestion to
the downside move in February and early March. A larger example came on the
breakdown into November and December as compared to the move just prior to the
August-October trading range. That prior move had taken place in July and into
the first half of August. In both examples the secondary move mimicked the
first. In the first set, each wave was around $2.50, while in the second set
each wave of selling lasted for just under a $4 move.

Gaps as Support/Resistance Price Levels
A final type of price support/resistance deals with gap levels. Gaps occur
most often when a security ends a trading session at one price level only to
open at a different price level. Most gaps fill eventually, meaning that the
prices will return to the pre-gap levels. The closure of a gap itself is one
form of price support/resistance.
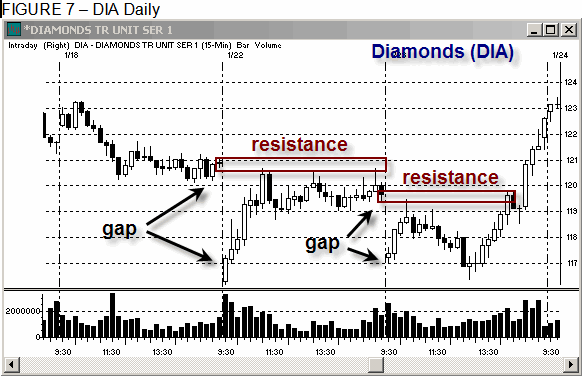
In the example of the Diamonds
(
DIA |
Quote |
Chart |
News |
PowerRating) below, there are two examples of a
morning gap. The first one highlighted took place into the open on the 22nd of
January, 2008. The second occurred the following morning on the 23rd. In each
instance, the downside gap itself exhausted the market and the buyers quickly
appeared. Before the morning was over the gap zone had been closed on both days
and the price level from the previous day’s close served as price resistance,
leading to a correction off those prices heading into noon.

Additional Support/Resistance Tidbits
When making comparisons on support/resistance levels, it can be difficult at
times to know just how much room one should give a support/resistance zone
before concluding that it has broken. It can also be difficult to determine
whether or not a certain support/resistance level will hold since not all will
hold well. There are a couple of things to keep in mind when giving this
consideration. First of all, smaller time frame support/resistance levels will
always be easier to break than those on a larger time frame, but the
support/resistance zones on the larger time frames will be wider. Additionally,
support/resistance levels which have the greatest number of types of
support/resistance hitting at the same time will hold best. In other words, a
support level which is hitting whole number support and gap support tends to be
stronger than one which is just hitting gap support. Since the exact prices of
each type which hits may not be exactly the same, this is another reason to
consider support/resistance levels as zones. When market professionals focus on
these simple forms of price support/resistance it gives them a leg up on any
competition relying merely on price patterns, as well as those who are so bogged
down in indicators that they can barely make out the price bars through all the
lines and squiggles!
Toni Hansen is
one of the most respected technical analysts and traders in the industry with a
high reputation for accuracy in both bull and bear markets. Her style of trading
and market analysis transcends both time as well as market vehicles, making it
attractive to investors and trader of stocks, futures, options, ETFs, and even
the FOREX market. Toni is a frequent lecturer at trading clubs and industry
expos. She is also a popular market columnist and is a repeat contributor to SFO
Magazine. She recently co-authored High Profits in High Heels from Marketplace
Books and SFO’s Personal Investor Series book Online Trading.
Email Toni
