Trade Logic
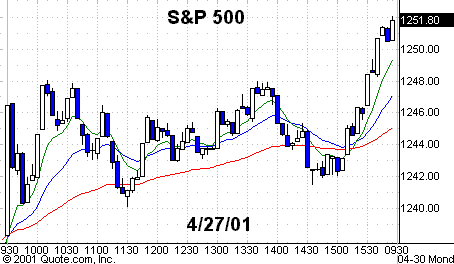
Friday
afternoon gave us a rally into
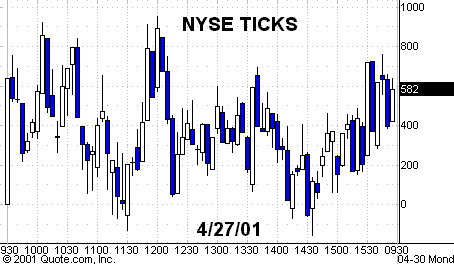
the close, which was preceded by a volume ratio that had remained at about 2:1
up volume vs. down volume for most of the day as the S&P 500
(
SPX |
Quote |
Chart |
News |
PowerRating) had
traded sideways between 1248 and 1240 until the index took off from 1241.51 to
close at 1253.05. Stocks like
(
NVDA |
Quote |
Chart |
News |
PowerRating) which ran 3 points had good pops into
the bell. The volume dynamic is very important to observe during the day in
relation to broader market movement. It gives you the quality of the story.
I have included charts of
five brokers:
(
LEH |
Quote |
Chart |
News |
PowerRating),
(
MER |
Quote |
Chart |
News |
PowerRating),
(
GS |
Quote |
Chart |
News |
PowerRating),
(
MWD |
Quote |
Chart |
News |
PowerRating) and
(
BSC |
Quote |
Chart |
News |
PowerRating) from last
Wednesday’s trading. These charts demonstrate that after thrust moves on
wide-range bars and significant volume, you often get three- to eight-bar
pullback setups or contracting Dynamite Triangles and consolidations.
I had mentioned on April 24
that I liked Technology, Energies and Brokers going forward on a continuation of
the rally. These brokers had gap-up thrust moves with volume on April 18, the
day the major indexes popped. Looking at the SPX and Nasdaq 100
(
NDX |
Quote |
Chart |
News |
PowerRating)
screens on Thursday morning as I do every morning, I saw that all the major
brokers had closed in the top 25% of their ranges and were at or above key EMAs.
When you see that in a
sector, it obviously indicates buying pressure and tells you to go to the daily
charts and look for setups. Checking the daily charts, I saw all five major
brokers had five-bar pullback setups with top-of-the-range closes. This
immediately put the brokers in the day’s trading plan looking for trade-through
entry above the previous high.
I suggested LEH and MER to
focus on that day because their patterns were strongest, with LEH being the
best. After its thrust day on April 18, LEH’s five-bar pullback was above all of
its daily EMAs. MER’s pattern was next best, as it had just recrossed and closed
above its 200-day EMA on the fifth pullback day and it was also above all of its
EMAs.
Needless to say, the buyers
returned and all five brokers had good pops that day. You had the brokers in
your trading plan because of good trade logic, not some magic formula or tout
sheet. You identified buying pressure in a sector and took action when the
Generals returned the next day to buy them again as you just got on the train in
the correct direction. The
five-minute charts are included to highlight the trade-through entries.
Today is the last day of
the month and suffice to say, the Generals would like to finish it on a positive
note, so that could lend some support to it. So far, we’ve only had three-bar
pullbacks in the NDX and SPX to their .38 retracement levels, accompanied by
significant percentage moves in many of the Game stocks and Semis. The SPX acts
like it wants to run up to its 200-day EMA of 1311 but I expect some air pockets
along the way.
Stocks
Today
|
(June
|
||
|
Fair Value
|
Buy
|
Sell
|
|
5.10
|
 6.40 |
 3.85Â
|
Stay all over the Semis
both ways, long or short. On your intraday charts you have:Â
(
NVLS |
Quote |
Chart |
News |
PowerRating),
(
KLAC |
Quote |
Chart |
News |
PowerRating),
(
MU |
Quote |
Chart |
News |
PowerRating),
(
NVDA |
Quote |
Chart |
News |
PowerRating),
(
AMD |
Quote |
Chart |
News |
PowerRating) {which closed at a new minor high on Friday),
also
(
BRCM |
Quote |
Chart |
News |
PowerRating),
(
MXIM |
Quote |
Chart |
News |
PowerRating) and
(
IRF |
Quote |
Chart |
News |
PowerRating).
In the Biotechs: look at
(
HGSI |
Quote |
Chart |
News |
PowerRating).
In the Brokers: LEH, MWD
and BSC.
In the Game stocks:
(
BRCD |
Quote |
Chart |
News |
PowerRating),Â
(
JNPR |
Quote |
Chart |
News |
PowerRating),
(
BEAS |
Quote |
Chart |
News |
PowerRating),
(
VRSN |
Quote |
Chart |
News |
PowerRating),
(
MERQ |
Quote |
Chart |
News |
PowerRating),
(
VRTS |
Quote |
Chart |
News |
PowerRating) and
(
SEBL |
Quote |
Chart |
News |
PowerRating).
Other Banks and Financials:
(
WFC |
Quote |
Chart |
News |
PowerRating),
(
C |
Quote |
Chart |
News |
PowerRating),
(
PVN |
Quote |
Chart |
News |
PowerRating),
(
FITB |
Quote |
Chart |
News |
PowerRating) and
(
NTRS |
Quote |
Chart |
News |
PowerRating).
Have a good trading day.
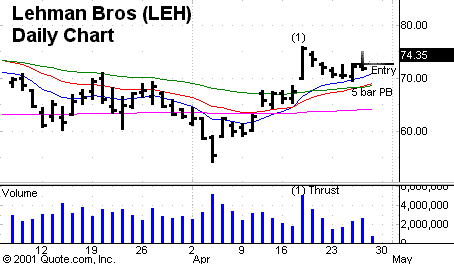
Chart 1. Daily
chart of Lehman Brothers
(
LEH |
Quote |
Chart |
News |
PowerRating) with 10-, 20-,
50- and
200-day
EMAs.
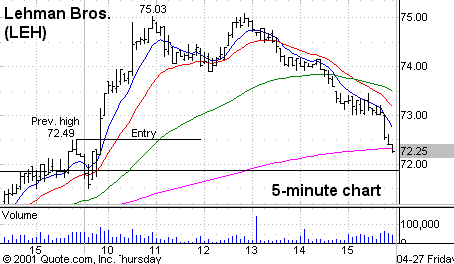
Chart 2. Five-minute
chart of Lehman
Brothers
(
LEH |
Quote |
Chart |
News |
PowerRating)
with 8-, 20-,
60-
and 260-period
EMAs.
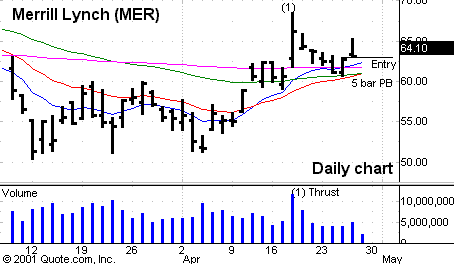
Chart
3. Daily
chart of Merrill Lynch
(
MER |
Quote |
Chart |
News |
PowerRating) with 10-, 20-,
50- and
200-day
EMAs.
Chart 4. Five-minute
chart of Merrill
Lynch
(
MER |
Quote |
Chart |
News |
PowerRating)
with 8-, 20-,
60-
and 260-period
EMAs.
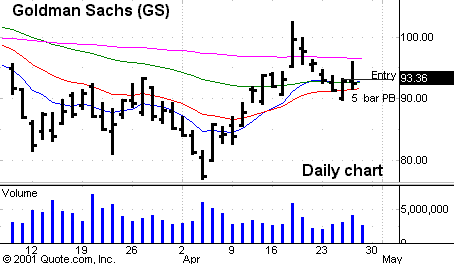
Chart
5. Daily
chart of Goldman Sachs
(
GS |
Quote |
Chart |
News |
PowerRating) with 10-, 20-,
50- and
200-day
EMAs.
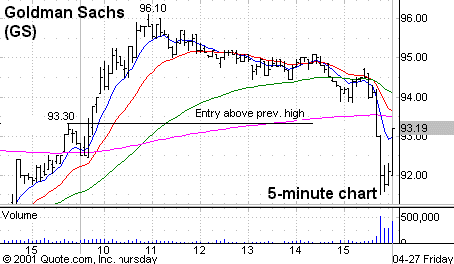
Chart 6. Five-minute
chart of Goldman
Sachs
(
GS |
Quote |
Chart |
News |
PowerRating)
with 8-, 20-,
60-
and 260-period
EMAs.
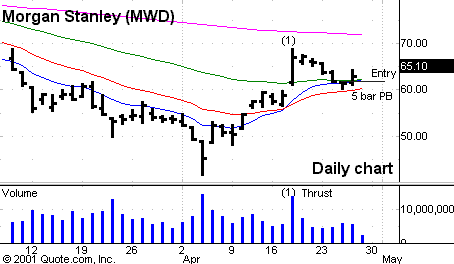
Chart
7. Daily
chart of Morgan Stanley
(
MWD |
Quote |
Chart |
News |
PowerRating) with 10-, 20-,
50- and
200-day
EMAs.
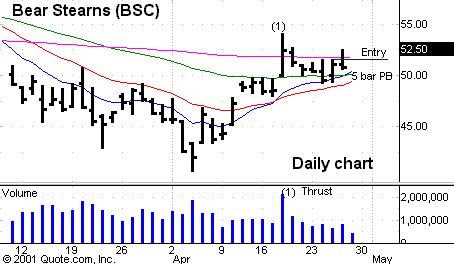
Chart
8. Daily
chart of Bear Stearns
(
BSC |
Quote |
Chart |
News |
PowerRating) with 10-, 20-,
50- and
200-day
EMAs.