Trade the Reaction Not the News
From 1990 to 1997, Kevin Haggerty served as Senior Vice President for Equity Trading at Fidelity Capital Markets, Boston, a division of Fidelity Investments. He was responsible for all U.S. institutional Listed, OTC and Option trading in addition to all major Exchange Floor Executions. For a free trial to Kevin’s Daily Trading Report, please click here.
Commentary for 5/9/11
In the previous commentary for 5/2/11 [The Market Time Period Alert] I included the SPX monthly chart that indicated how extended the SPX was coming into the May seasonal time period, and said there is a key cycle date in mid-June, which follows the 4/24/11 time symmetry after which the SPX made new cycle highs at 1370.58 on 5/2/11.
The SPX was -1.7% last week as it finished at 1340.20, and above the 20DEMA. The weekly decline intraday was -3.0% from 1370.58 to 1329.17, which is not that bad relative to the commodity sector implosion led by the SLV which was -26.5% on the week as margin requirements were raised resulting in significant margin calls. The USD was +2.7% on the week, with the USO -14.5% [-9.1% 5/5], HUI -10.0%, OIH -8.8%, XLE -7.3%, GLD -4.7%, and the XME -4.5%.
The commodity implosion last week is obviously a significant decline in momentum, and that has to affect the equity market, which has been so complacent about the Fed`s ability to keep the game going after the end of QE2 in June. The SPX will probably at best remain in a trading range near term, or have a significant correction of at least 8-10% if it is advancing into mid June.
Everyone loves a “no brainer” winning trade, and the artificially inflated jobs report last Fri of +244,000 jobs, versus the +185,000 expected by the market [???] gave us what we wanted. The number was inflated by +175,00 jobs from the Birth/Death Adjustment, so I guess the negative increase in Initial Claims the previous day to 474,000 shook the Political troops up and the BLS decided to rush to the rescue.
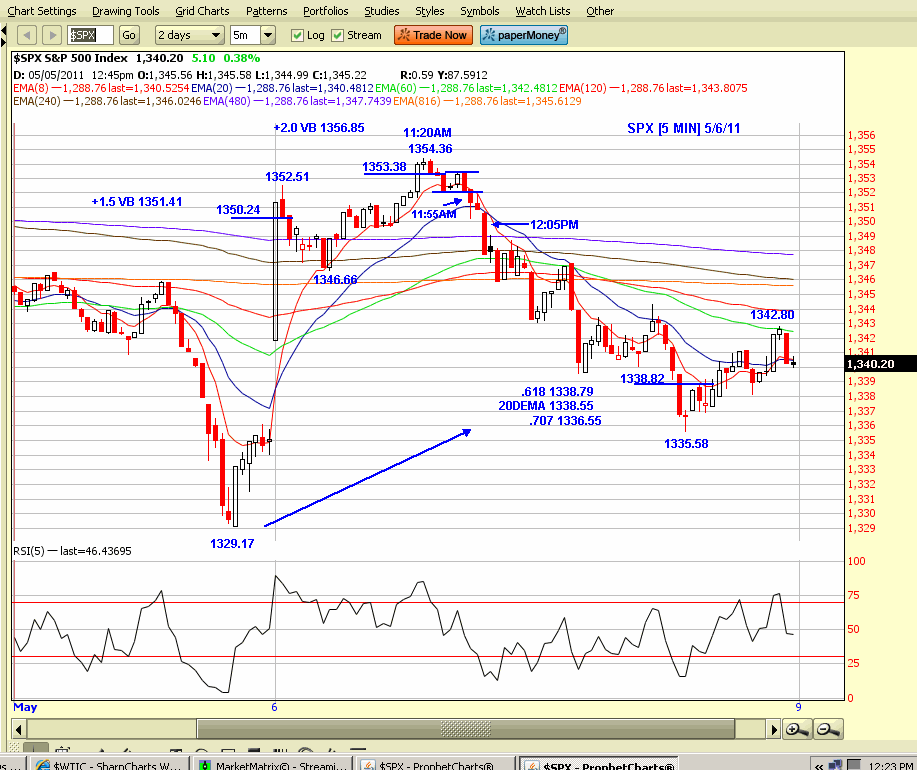
I have included the SPX 5 min chart from the Trading Service commentary which outlines the trading reaction to the significant gap up opening. The SPX hit 1352.51 on the second bar versus the +1.5 VB at 1351.41, so the initial short was taken below the reversal bar low of 1350.24. It only traded down to 1346.66 before reversing, and most traders either scratched the trade or took a small profit on a trail stop with whatever they were using to play it.
The next reversal opportunity followed the 1354.36 high on the 11:20AM bar, with the +2.0 VB up at 1356.85. The short entry was below 1353.38, and it traded down to a 1335.58 low followed by a reversal of the 20DEMA at 1338.55, and also the 1338.79 .618RT to 1329.17 from 1354.36. The SPX was also accelerated on the decline as the UUP went trend up in the afternoon.
If you know the symmetry levels each day, in addition to the Volatility Bands, then you can navigate the market reactions with a high probability of success.

Click here to find full details on Kevin’s courses including Trading with the Generals with over 20 hours of professional market strategies. And for a free trial to Kevin’s daily trading service, click here.
