Trading Venues Change But Basic Strategies Remain the Same
From 1990 to 1997, Kevin Haggerty served as Senior Vice President for Equity Trading at Fidelity Capital Markets, Boston, a division of Fidelity Investments. He was responsible for all U.S. institutional Listed, OTC and Option trading in addition to all major Exchange Floor Executions. For a free trial to Kevin’s Daily Trading Report, please click here.
Commentary for 2/22/11
It was another week of major index new cycle highs, while the SPX was +1.0 on the week to 1343, and has advanced 10 0f the last 12 weeks. The commodity sectors which are a primary focus in the Trading Service were the big winners for the week led by the OIH +5.9, HUI +5.8, XME +3.9, and GLD +2.5.
A correction in the equity market and a significant rise in the USD would put significant pressure on most commodity stocks/ETF`s. However, the current perception is mostly that the continuation of QE2 will continue to debase the USD, and that translates to strength in commodities. Interest rates have continued to rise during QE2, which was not part of the Feds plan, but it has been able to send the equity markets on a vertical move as the SPX was a double at 1334, and is +101.3% low to high since the 3/6/09.
If you bought the market in Feb-Jul 2009 you are a happy camper, but if you are getting sucked into the market now you are destined to be a big loser once again, and had better be reducing equity allocations, or have a downside exit strategy/hedge.
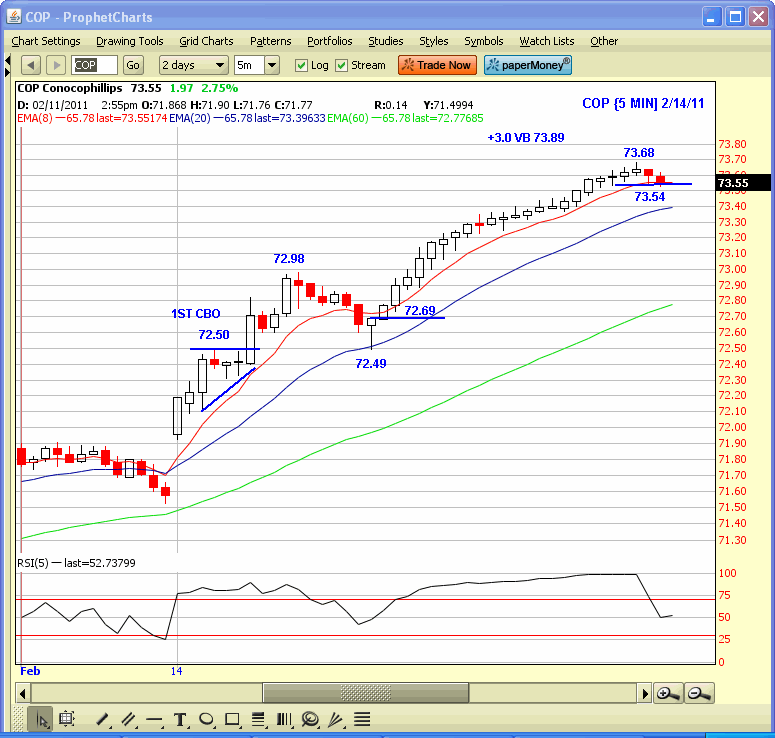
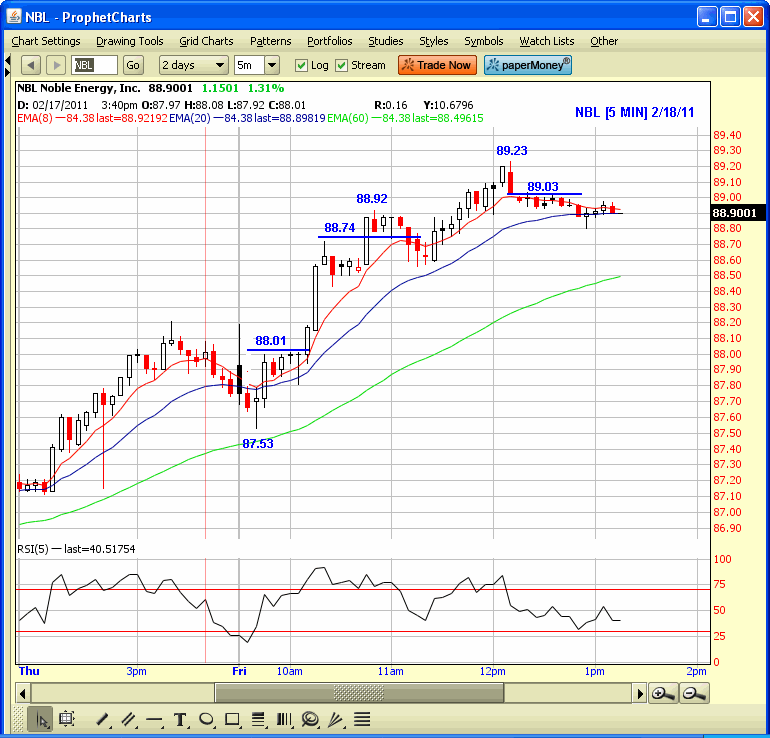
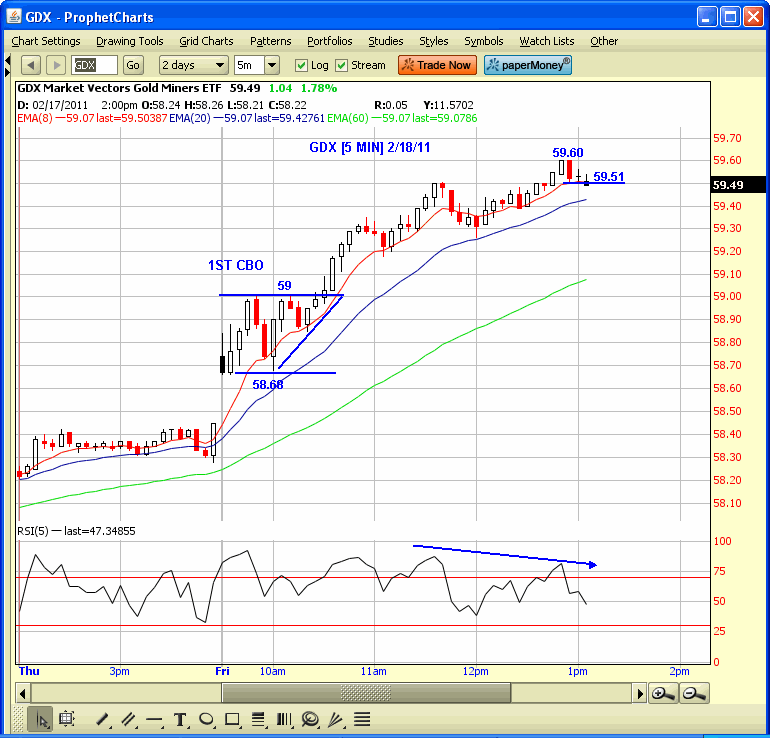
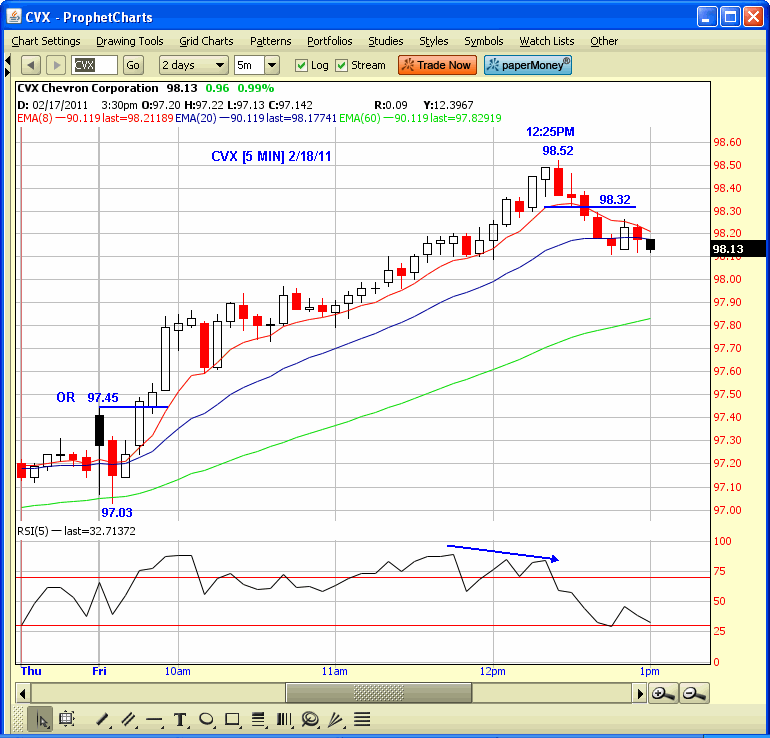
I have included some of the primary focus commodity sector day trades from last week, and although the major index volatility is at 52 week lows, there is still significant volatility in the energy, gold, and precious metals sectors. The following trade examples are all basic strategy setups in the Trading Service, and are also explained in the “Trading with the Generals” course, and the “How To Trade Major First-Hour Reversals” trading module
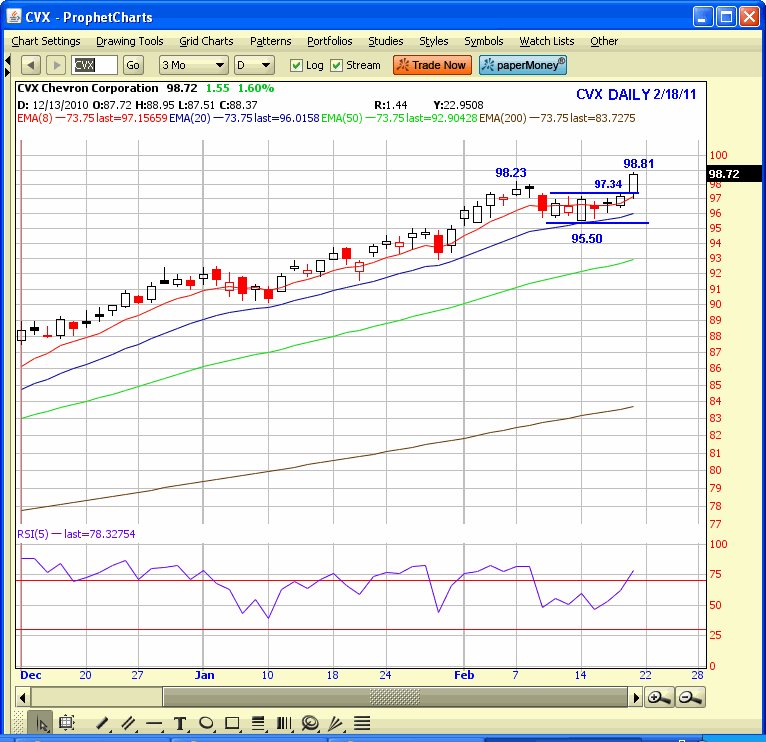
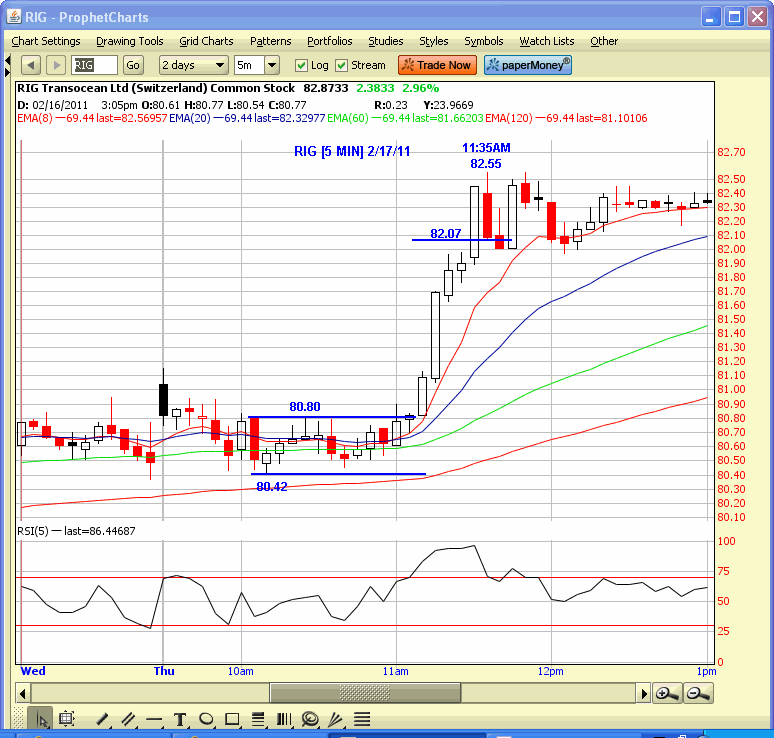
The trade examples include 1st Consolidation B/O`s in COP, NBL, and GDX, followed by the Opening Reversal B/O for CVX, which includes the daily CVX chart that highlights the fact that it was also a range B/O at the highs, which is always a good combination for day traders to be aware of. The last chart is the RIG 11 bar contracted volatility range B/O above 80.80 and all the EMA`s.
It doesn’t matter how electronic the markets are, or that there are over 40 different venues and various dark pools used by institutional investors, because the basic strategies have not changed, especially trading contracted and extended volatility. However, it is important to have the proper primary trading focus, which obviously magnifies the trading opportunities.
Have a good trading day!
Click here to find full details on Kevin’s courses including Trading with the Generals with over 20 hours of professional market strategies. And for a free trial to Kevin’s daily trading service, click here.
