Ratio Watch
One of the most important
tools in the sector trader’s arsenal is the ratio between two different but
related markets. This technique
is commonly referred to as “relative strength analysis” and has nothing to
do with the technical indicator known as “RSI” found in most charting
applications.Â
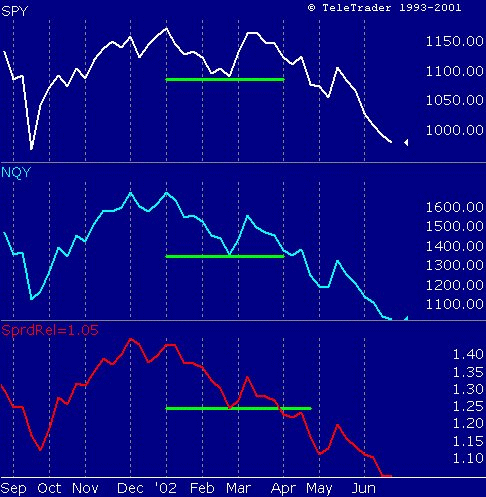
The chart below shows the
weekly price series of the SP500, the Nasdaq 100 and the ratio between the two
(i.e., the Nasdaq 100 divided by the S&P 500). Simply put, when the ratio is rising,
as it was between October and
December of last year, the Nasdaq 100 is gaining in strength relative to the
S&P 500. When the ratio is
declining, the Nasdaq 100 is outpacing the S&P 500 to the downside.

At its lowest point in
October 2001, this ratio equaled approximately 1.10. Today this ratio is even less, at about 1.05, indicating that the
Nasdaq100 is even weaker than the SP500 on a relative basis than it was after
Sept. 11. Indeed, the Nasdaq 100 has led the market lower since peaking
in December 2001. Note in recent weeks the ratio line broke down through support, ahead
of the action in both of the underlying indexes (see green lines).Â
In sum, the Nasdaq 100, a
technology-dominated index, continues to be the focal point of the bears.
On a separate note. This column is chiefly devoted to stock market sector analysis and
trading. However, I can’t
resist the temptation to toot my own commodity horn from time to time. From my
5/17/02
column: “… the major risk is not to the downside at this point. The corn market has just had a good rally, and I wouldn’t be surprised
if it was the start of something larger.â€Â And from my
5/31/02
column: “… I maintain my bullish posture on Corn, and the grains in
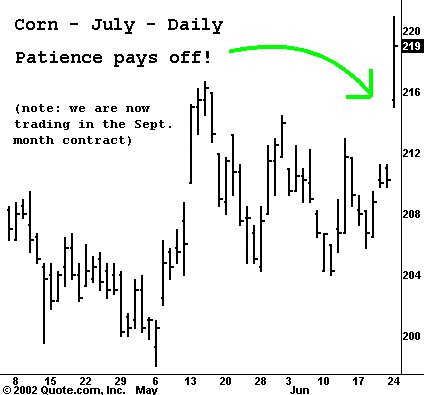
general.â€Â Corn chart
posted below for your convenience!

