An Important Week for Gold, and Gold Stocks
Well Thanksgiving turned out to have some
important action, and now several important trendline tests in major markets are
developing that investors should keep an eye on even during the thin holiday
trading ahead, unfortunately.
We talked last week about the important test of
support developing in gold and gold stocks. It is so far unresolved but
continues to be important for that market. With copper and copper stocks and
other base metals falling this week, more weight has been put to bear on the
bull move in gold and gold stocks since this summer.
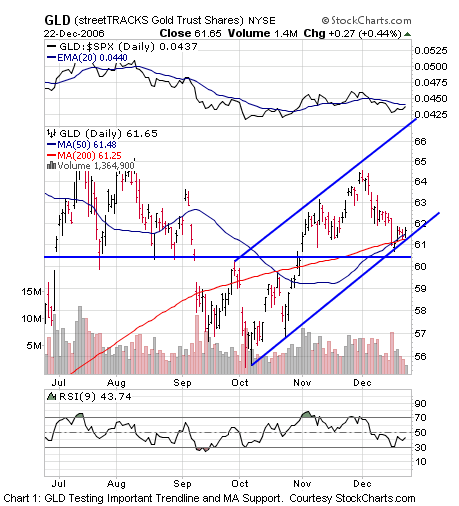
Chart 1 shows
(
GLD |
Quote |
Chart |
News |
PowerRating) testing the up trend
channel support line from the October lows at about the same level as both the
50-day and 200-day MA lines, here in the 60-61 support zone. A high volume
strong closing rally from here or that holds above 60 over the holidays would be
supportive of further gains and a test of December’s highs, whereas a high
volume weak close below 60.25 would be quite negative for gold, particular if it
is accompanied by a breakdown in gold stocks.
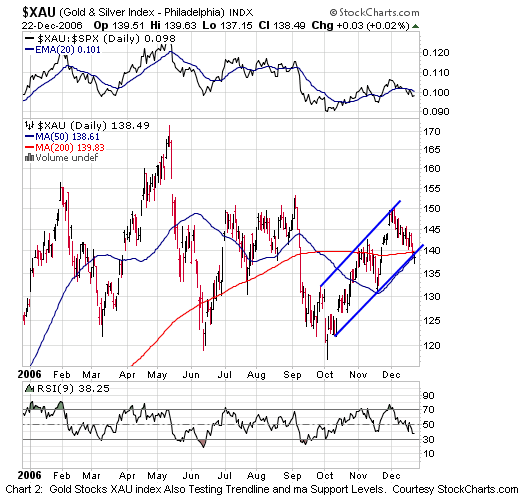
Gold stocks have been weaker than gold itself
recently, which is rarely a positive sign for metals prices. Chart 2 shows that
gold stocks have been in a trading range between roughly 120 and 150 since May.
It is unclear whether the upmove from October represents a move within this
trading range or a new up leg. The gold stock
(
XAU |
Quote |
Chart |
News |
PowerRating) index is currently
testing up trend channel support and its 200 and 50-day MA levels as well, and
is slightly more negative looking than GLD as of today. A high volume weak close
under 137 accompanied by a GLD close below 60.25 would turn the outlook for gold
and gold stocks toward a retest of October’s lows.
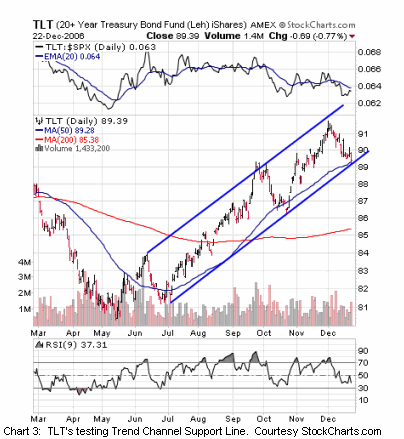
But gold and gold stocks aren’t the only trend
line testers during this holiday season. Bonds, one of our favorite markets
since the Spring, have backed off and are testing their first layer of support
at both the 50-day MA and at the up trend channel support lines shown in Chart
3. While a break of this first level of support would not be as damaging to
bonds and the test of 200 MA support in gold and gold stocks, US stocks have
been provided a substantial cushion of support by bond rallies during the
economic slowdown this year, and a break of support by bonds would indicate less
of a support line toward stocks moving forward.
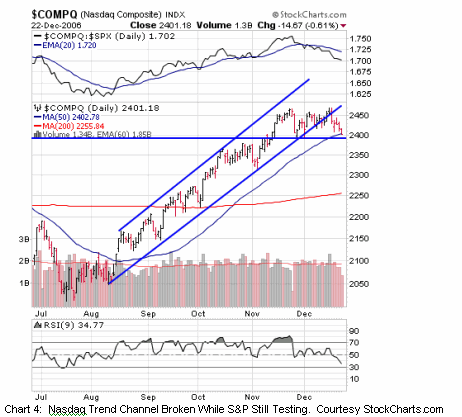
And in fact stocks themselves seem to be testing
up trend channel support lines over this holiday period as well. Chart 4 shows
the Nasdaq Composite having actually broken down below its trendline support
this week. However both the S&P and Dow have so far held trend line support. Yet
a high volume weak close by the Naz below its double top formation at 2388,
below the up trend channel support by DIA of 122 and the S&P index below 1404
would setup the first real correction of the entire move since August since the
summer lows. We are noticing for the first time a growing number of sectors
turning down in earnest, like transports and consumer electronic retail, as
well. Certainly until ALL the averages break their first support zones, the up
trend deserves the benefit of a doubt, but investors may want to watch closing
action during the holidays on further weakness that breaks the above levels.
Overall we still continue to suggest less than
aggressive allocation to global equities, however we would no longer look to add
or accumulate TLT’s on corrections and would begin taking partial profits on
TLT’s over 92. We still expect that the slowdown is not over and that the Fed
will not letup on a tightening bias until the slowdown develops more clearly so
that inflation does not reappear and get entrenched, but bond gains have been
swift and further bond yield declines will become less likely unless a recession
develops. The risk of recession is still large enough that we would not suggest
selling ALL or even half of TLT’s yet, but some profit taking will soon be in
order we believe. We also continue to like some pairs, and some select big-cap
dominated groups along with the small number of stocks meeting our criteria for
below normal allocation to stocks with partial short-hedging in weaker groups.
We’ll do more looking ahead into 2007 in the
weeks ahead. Watch things over the holidays, and may I wish a very Happy Holiday
season to all, and a very prosperous New Year in 2007!
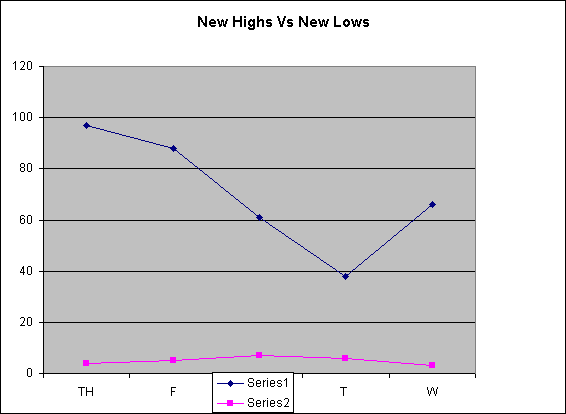
Our US selection methods, our Top RS/EPS New
Highs list published on TradingMarkets.com, had readings of 97, 88, 61,38 and 66
with 12 breakouts of 4+ week ranges, valid trades meeting criteria in STA and no
close calls. This week, our bottom RS/EPS New Lows recorded readings of 4, 5, 7,
6 and 3 with 1 breakdowns of 4+ week ranges, no valid trades and no close calls.
SPI, BWP, CHDX, OTEX, OPNT, BRCD, TV, STEC, CKH, OMX, BTJ, ININ, STA remain open
trades on the long side from this methodology. You should have profits locked in
on trailing stops in all of these but OPNT, BTJ, and STA — and even on these we
would begin raising stops above original ops’s, especially if the market
violates up trend support as indicated above.
Mark Boucher has been ranked #1 by Nelson’s World’s Best Money Managers for
his 5-year compounded annual rate of return of 26.6%.
For those not familiar with our long/short strategies, we suggest you review my
book “The Hedge Fund Edge“, my course “The
Science of Trading“, my video seminar, where I discuss many new techniques,
and my latest educational product, the
interactive training module. Basically, we have rigorous criteria for
potential long stocks that we call “up-fuel”, as well as rigorous criteria for
potential short stocks that we call “down-fuel”. His website is
www.midasresourcegroup.com.
