An Opportunity in Biotech
After brushing off initial opening weakness, the Nasdaq Composite rallied
0.7% and recovered more than half of its previous day’s loss, but an afternoon
selloff caused the index to close flat. The other indices showed relative
strength by retaining most of their morning gains. The S&P 500 gained 0.4%
and the Dow Jones Industrial Average advanced 0.5%. Small and mid-cap stocks,
which have been lagging the broad market for several months, suddenly perked up.
The small-cap Russell 2000 and S&P Midcap 400 indices rallied 1.0% and 0.8%
respectively.
Turnover increased across the board, which could be considered positive for
the S&P, but negative for the Nasdaq. Total volume in the NYSE was 12%
higher than the previous day’s level, enabling the S&P to register a bullish
“accumulation day.” In the Nasdaq, volume increased by 5%. When an index closes
flat, but on higher volume, it is often representative of bearish “churning”
because more shares are changing hands, but prices go nowhere. “Churning” is
usually a sign of institutional selling into strength, but the Nasdaq’s minimal
turnover increase of 5% was not substantial enough to declare yesterday’s
session as “churning.” Market internals were mixed. Advancing volume in the NYSE
exceeded declining volume by a ratio of 2 to 1, but the Nasdaq ratio was
fractionally negative.
In yesterday’s newsletter, we highlighted two ETFs that we were stalking for
potential long entry, one on a pullback and the other on a breakout. With the
Biotech HOLDR
(
BBH |
Quote |
Chart |
News |
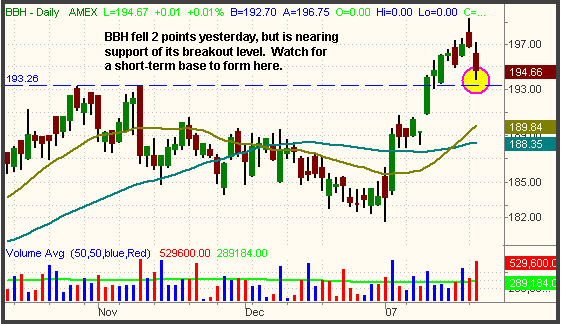
PowerRating), we were waiting for a pullback to support of the breakout,
around the $193.25 level. Yesterday, BBH pulled back to within 70 cents of that
level before finishing at $194.66. Since strong stocks and ETFs often pullback
to near the breakout level without actually touching it, there is a
chance that the short-term correction may already be finished. However, rather
than merely guessing, we will analyze today’s action to see if a base forms near
yesterday’s low. If it does, we would then consider buying a breakout above the
short-term hourly downtrend line that will form. Remember the most basic tenet
of technical analysis states that a prior resistance level becomes the new
support level after the resistance is broken. That’s why it is a low-risk play
to buy BBH on a pullback to the $193 to $194 area. As you can see on the daily
chart below, BBH nearly tested new support of its breakout level
yesterday:
 border=0 width=”561″ height=”324″>
 The other ETF we were stalking for potential entry was the StreetTRACKS Gold
Trust
(
GLD |
Quote |
Chart |
News |
PowerRating), which we planned to buy on a breakout above its long-term weekly
downtrend line. On the open, GLD gapped above the intraday high of the previous
day, then trended steadily higher throughout the session, finishing at its best
level of the day. Not only did its opening gap put GLD above the weekly
downtrend line, but the gap above the previous day’s high also increased the
odds of further upside momentum in the short-term. Below is an updated daily
chart of GLD, which we bought at the 63.90 level:
Human nature might tell you to avoid a stock that closed weak the previous
day and then gapped open above that day’s high, but that “fear” is exactly why
this type of play works. When GLD gapped open above its downtrend line, it
attracted traders (such as ourselves) who were waiting for the breakout. That
fueled GLD even more, which caused the investors and traders who dumped the
previous day, afraid to miss the move, to get back in at a higher price. This is
why opening gaps above the high of a previous down day are often among the
strongest days.
Though the Nasdaq is definitely weaker, the S&P and Dow remain indecisive
and rather choppy. Unfortunately, they may remain that way until earnings season
has concluded. Be prepared for a big wave of earnings reports over the next
three days.
Open ETF positions:
Long GLD, QID,
short FXI (regular subscribers to The Wagner Daily receive detailed stop
and target prices on open positions and detailed setup information on new ETF
trade entry prices. Intraday e-mail alerts are also sent as needed.)
Deron Wagner is the head trader of Morpheus Capital Hedge Fund
and founder of Morpheus Trading Group, which he launched in 2001. Wagner appears
on his best-selling video, Sector Trading Strategies (Marketplace Books,
June 2002), and is co-author of both The Long-Term Day Trader (Career
Press, April 2000) and The After-Hours Trader (McGraw Hill, August 2000).
Past television appearances include CNBC, ABC, and Yahoo! FinanceVision. He is
also a frequent guest speaker at various trading and financial conferences
around the world. For a free trial to the full version of The Wagner
Daily or to learn about Deron’s other services, send an e-mail to title=mailto:deron@morpheustrading.com
href=”mailto:deron@morpheustrading.com”>deron@morpheustrading.com.
