Here’s what’s next for commodities
Using traditional Elliott Wave
applications, where could we possibly be in the commodity rally? For
those of you who know nothing about Elliott Wave, it is basically the premise
that the market moves in the direction of the larger trend in five waves and
corrects that larger trend in three waves. The fourth wave must never move into
the area of the first wave and the third wave can never be the shortest. Based
on these simplest of premises, I reviewed the monthly chart of the CRB Index so
I could get a clearer idea as to how mature the rally is in commodities.

If we assume that Wave I was the start of the rally that began
in January 2002, it now appears as if we have just moved into Wave IV after and
extended Wave III. Because this is a monthly chart, I am assuming that these
Waves are of Cycle degree and therefore using the nomenclature as such. This
count assumes that an A-B-C (three wave correction) ended in October 2001. This
count satisfies the two rules laid forth in the first paragraph for the larger
moves and the subdivisions. The chart below is another interpretation of the
monthly CRB Index based on Elliott Wave Principle.
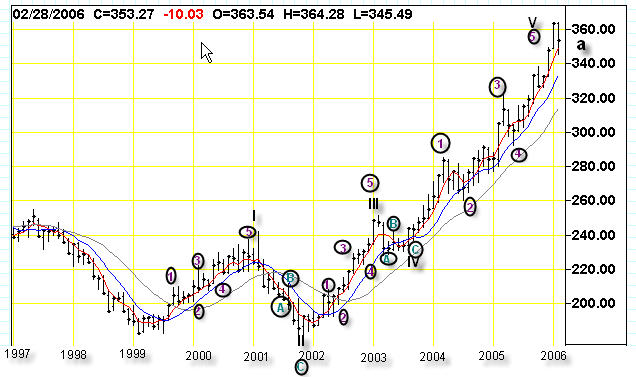
This, too, follows the rules mentioned in the first paragraph.
It is often common for Elliott Wave practitioners to have an “alternate countâ€.
This count, however, deems the rally much more mature and, actually, puts us
into the 1st wave of a likely three wave correction. If this is correct, we have
just finished wave 5 of V, which could be the ending of the rally. I suppose
only time will tell. I do not use Elliott Wave on a regular basis, but it is
another piece to the puzzle. I will, therefore, most likely, be bullish on the
monthly chart of the CRB until/unless we get some sort of trend-line
deterioration, other than the short-term moving average violation that is now
present.
Sara Conway is a
registered representative at a well-known national firm. Her duties
involve managing money for affluent individuals on a discretionary basis.
Currently, she manages about $150 million using various tools of technical
analysis. Mrs. Conway is pursuing her Chartered Market Technician (CMT)
designation and is in the final leg of that pursuit. She uses the Point and
Figure Method as the basis for most of her investment and trading decisions, and
invests based on mostly intermediate and long-term trends. Mrs. Conway
graduated magna cum laude from East Carolina University with a BSBA in finance.