Market testing up trend from July lows
Last week we reviewed the important levels that a
number of asset classes and indexes were testing. So far
(
GLD |
Quote |
Chart |
News |
PowerRating) broke
out of its H&S bottom and broke its down trend line but
(
XAU |
Quote |
Chart |
News |
PowerRating) has still not broken
its down trend and bears close watching. Oil is trying to bounce off of the
broad support level indicated and
(
USO |
Quote |
Chart |
News |
PowerRating) still needs to prove itself on the upside
by breaking above last week’s highs to indicate a correction of the decline
since July is underway.
While the
(
QQQQ |
Quote |
Chart |
News |
PowerRating) and NASDAQ both broke their
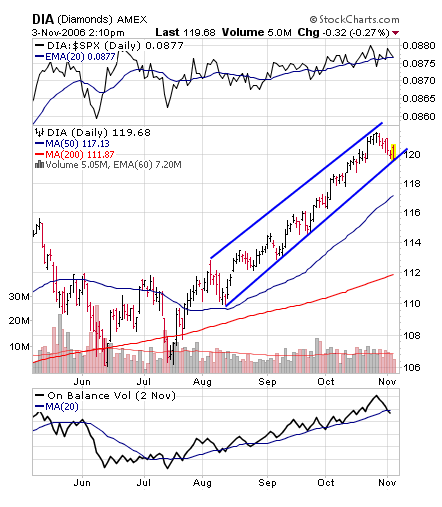
uptrend line late this week, investors should note that the Dow and S&P are only
testing theirs. The chart below shows the similar picture of both the Dow and
S&P which on Friday are testing their uptrend lines but have not broken them. A
clear break below the uptrend lines by the Dow and S&P would confirm a potential
correction underway of the rally since July. So far that has not yet happened
yet however.

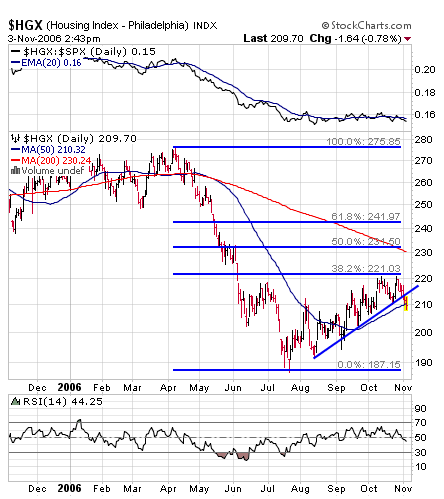
We also showed the critical zone being tested by the housing index last week.
This week, as shown in chart 2, the
(
HGX |
Quote |
Chart |
News |
PowerRating) index broke the uptrend line and broke
below a short-term double top pattern off of a Fibonacci resistance level that
we illustrated last week. Housing stocks appear set to underperform again
therefore until the highs of the last few weeks are breached.

It will be important to see if the major big-cap indexes can hold their up trend
lines. Traders sentiment has gotten overly optimistic and we pointed out the
resistance levels the market was up against last week. In addition this week’s
economic indicators have shown that the economy is still clearly slowing further
but not at a rate that would indicate a recession. The market showed an
increasing sensitivity to weaker economic statistics and earnings reports this
week. Moving forward we suspect the action will be choppier than since July.
Stocks are likely to react negatively to increasing evidence of weakening,
whereas bonds are likely to react negatively to economic indications of
stabilizing from here on in.
There is still a half decent chance that economic reports will show enough
slowing that the market as a whole will correct the rally from July. A break
down on strong volume below the up trend lines in the S&P and Dow would be the
first technical confirmations that such a correction is beginning — and this
bears close watching by investors ahead.
We still suggest less than aggressive allocation to global equities and would
look to add or accumulate
(
TLT |
Quote |
Chart |
News |
PowerRating) on corrections as we expect that the slowdown is
not over and that the Fed will not letup on a tightening bias until the slowdown
develops more clearly so that inflation does not reappear and get entrenched. We
like some pairs, and some select big-cap dominated groups along with the small
number of stocks meeting our criteria for below normal allocation to stocks.
Lots of bonds and cash as well as light big-cap exposure still
seems prudent to us here until the environment becomes clearer. Long/short pairs
like Large cap/small cap, Spain/Germany, and Software/Semiconductors, and some
big-cap exposure to areas like pharmaceuticals and telecoms can be sparingly
participated in as well. The tradeoff between bonds and stocks should be closely
monitored as bonds are providing a critical cushion to the blow of a slowing
economy in what we suspect is a budding soft-landing that often prove difficult
to trade.
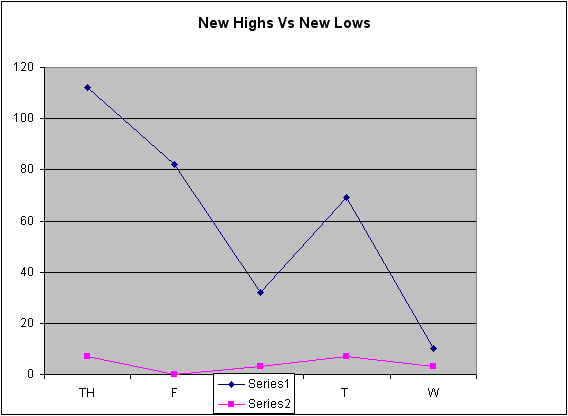
Our US selection methods, our Top RS/EPS New Highs list published on
TradingMarkets.com, had readings of 112, 82, 32, 69 and 10 with 17 breakouts of
4+ week ranges, no valid trades meeting criteria , and one close call in BWP.
This week, our bottom RS/EPS New Lows recorded readings of 7, 0, 3, 7 and 3 with
2 breakdowns of 4+ week ranges, no valid trades and no close calls. SPI remains
an open trade on the long side from this methodology, as TWGP should have exited
on trailing stops.

Mark Boucher has been ranked #1 by Nelson’s World’s Best Money Managers for
his 5-year compounded annual rate of return of 26.6%.
For those not familiar with our long/short strategies, we suggest you review my
book "The Hedge Fund Edge", my course “The
Science of Trading“, my video seminar, where I discuss many new techniques,
and my latest educational product, the
interactive training module. Basically, we have rigorous criteria for
potential long stocks that we call “up-fuel”, as well as rigorous criteria for
potential short stocks that we call “down-fuel". His website is
www.midasresourcegroup.com.
