On the Lookout for High-Volume Selling
A negative reaction to Intel’s
quarterly earnings report triggered a selloff in the tech sectors and the Nasdaq,
but the rest of the major indices were little changed. The Nasdaq
Composite managed to trade in a sideways range throughout the first half of the
day, but sellers took control in the afternoon, causing the index to close 0.7%
lower. The S&P 500 showed relative strength by giving up an early gain to lose
only 0.1%. The small-cap Russell 2000 fell 0.3%, but both the Dow Jones
Industrial Average and the S&P Midcap 400 indices were unchanged. Each of the
major indices finished in the bottom third of their intraday ranges.
Turnover marginally increased in both exchanges, causing the
Nasdaq to register a bearish "distribution day." Total volume in the NYSE
increased by 1%, while volume in the Nasdaq was 5% higher than the previous
day’s level. The 0.7% decline on 5% greater volume was indicative of
institutional selling, but it was only the Nasdaq’s second "distribution day"
within the past four weeks. Even healthy markets will occasionally see a day or
two of institutional selling, but four or more such "distribution days" within a
four week period will usually lead to bearish trend reversals. As such, we will
be on the lookout for any additional sessions of higher volume selling that
occur in the coming days. Like the price divergence in the major indices, market
internals were mixed as well. Advancing volume in the NYSE exceeded declining
volume by a margin of 1.2 to 1, but the Nasdaq ratio was negative by
nearly 3 to 1.
In the first two weeks of the new year, the Nasdaq showed
major relative strength to the S&P and Dow by rapidly breaking out to a fresh
six-year high. But we also warned that corporate earnings season has a bad habit
of ruining solid technical chart patterns. On January 10, for example, the
Semiconductor Index ($SOX) broke out above a one-year downtrend line, but
Tuesday night’s earnings report from Intel caused the index to give back all of
its January 10 gain and then some. The $SOX closed yesterday right at support of
its 20-day MA and just a bit below its 50-day MA, but it would not require a lot
of selling pressure to send the index back down to its December low. If the $SOX
fails to hold above yesterday’s low, it could rapidly drop down to once again
test support of its 200-day MA. As such, we sold half of our long position in
the Semiconductor HOLDR
(
SMH |
Quote |
Chart |
News |
PowerRating) into strength yesterday morning in order to
reduce our risk exposure. Below is a chart of the $SOX index:

The heavily weighted $SOX index nearly always leads the Nasdaq
in both directions, which is why the Nasdaq came under so much pressure
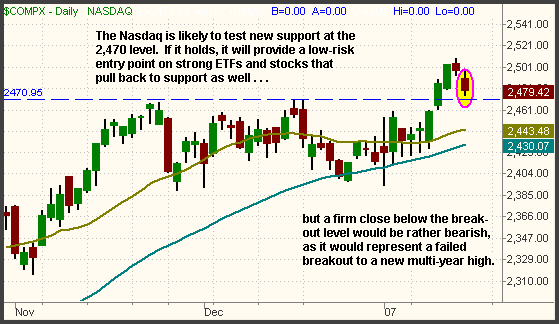
yesterday. But even though the Nasdaq slid 0.7%, it is still holding above
support of its multi-year breakout level. As you can see on the chart below,
horizontal price support for the Nasdaq should now be found at the 2,470 level,
which was resistance of its prior high:

If the Nasdaq finds support at the 2,470 area in the coming
days, it will confirm its recent bullishness, and could also offer low-risk
entry points on strong ETFs that have pulled back to support as well. However,
all bets are off on buying the tech sectors if the Nasdaq registers a firm close
below 2,470. Note that intraday "stop hunts" below that level are to be
expected, but the important factor is whether or not the index actually
closes below support of its breakout level.
As for the S&P and the Dow, recall from the January 17 issue
of The
Wagner Daily that they remain at pivotal resistance of their multi-year
highs. Yesterday, both indices probed to new highs on an intraday basis, but
again finished the day below their respective resistance levels. The S&P Midcap
400 and Russell 2000 indices failed to test new highs yesterday, but both are
still within striking distance of breaking out. The reaction to earnings reports
from Apple, Merrill Lynch, Motorola, and other closely-watched companies in the
coming days will determine whether the major indices "make it" or "break it"
from here. Remember to trade what you see, not what you
think!
Open ETF positions:
Long SMH (half position), short EEM and FXI (regular subscribers to
The Wagner Daily receive detailed stop and target prices on open
positions and detailed setup information on new ETF trade entry prices. Intraday
e-mail alerts are also sent as needed.)
Deron Wagner is the head trader of Morpheus Capital Hedge
Fund and founder of Morpheus Trading Group (morpheustrading.com),
which he launched in 2001. Wagner appears on his best-selling video, Sector
Trading Strategies (Marketplace Books, June 2002), and is co-author of both The
Long-Term Day Trader (Career Press, April 2000) and The After-Hours Trader
(McGraw Hill, August 2000). Past television appearances include CNBC, ABC, and
Yahoo! FinanceVision. He is also a frequent guest speaker at various trading and
financial conferences around the world. For a free trial to the full version of
The Wagner Daily or to learn about Deron’s other services, visit
morpheustrading.com or send an e-mail
to deron@morpheustrading.com .
