Some Important Moves Being Made
The Thanksgiving Holiday is normally dead time for global
markets, but this year was a definite exception. During the holiday the EURO
broke out and the dollar broke down out of a weekly trading range that has been
in force for over six months. By the time US traders returned to the markets,
intermediate-term damage was done and critical levels had been surpassed.
As Chart 1 suggests, the dollar is now likely to test the major support zone
between 78-80 that has held on every attempt since it started trading against
other currencies in 1972. Investors should realize that this level has held on
tests in 1978, 1991, 1992, 1995, and 2004. It is very likely that AT A MINIMUM
the dollar will hold at this level for a while and at least consolidate, if this
level does not prove lethal to its bear market. Therefore while the dollar has
broken down out of a six month range and has even broken above last year’s highs
versus the British Pound (though resistance at 2.00 is right overhead here as
well), there may be an intermediate and short-term limit to how far and how fast
the dollar can fall.

Chart 1: Dollar Breaks Trading Range But Major Support Not Far Away. Courtesy
StockCharts.com
Europe in particular is playing up the dollar decline in the press as though it
were breaking all-time lows. That is not yet the case. But markets are reacting
to the dollar down move in fairly significant fashion. Just beware that the
downside is somewhat limited absent a very surprising move in the dollar below
major support without much consolidation, which is unlikely.
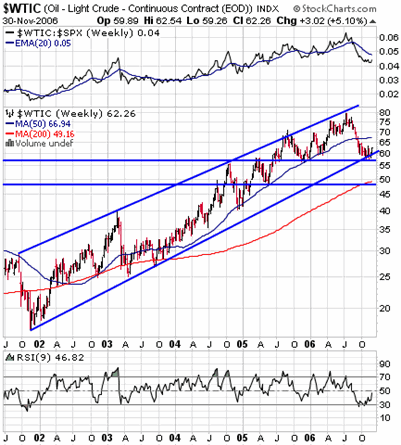
Chart 2: Crude Oil Hitting Weekly Trendline Support At Top of Support Zone.
Courtesy StockCharts.com
The dollar decline comes at an important point for many commodities and is
reigniting bullish flames there. Chart 2 shows that crude oil has tested an
important trend channel support zone around 58 and is rallying off of it with
help from the weather, OPEC rhetoric, and the declining dollar. Nearby natural
gas futures have broken out of a multi-month consolidation to the upside, and
oil stocks led the bottom as they would be expected to do. We suspect
commodities will run as long as the dollar is weak and as long as the global
economic slowdown does not look to be accelerating too briskly. One way (among
many) that investors can play both the dollar decline and the commodity runup is
via ETF’s in commodity indexes such as GSG, shown in Chart 3. Note that the
trading range in force since September between roughly 40 — 43 has been broken
in GSG while its relative strength has broken above its down trend line and
while its OBV has led the breakout. Investors wanting a vehicle to play the move
in oil, gold, and other commodities could use GSG or other similar ETF’s — just
realize you may want to take half profits when the dollar approaches its major
support zone.
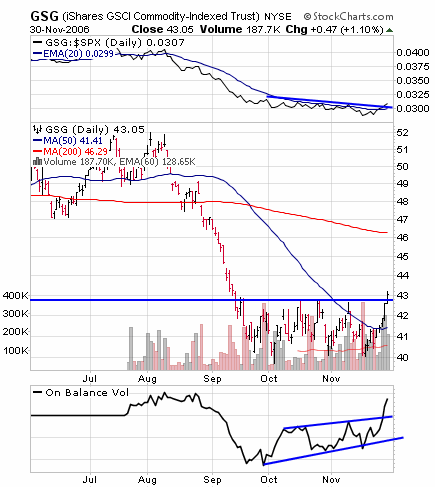
Chart 3: Goldman Sachs Commodity Index Base Breakout. Courtesy StockCharts.com
The Thanksgiving fireworks didn’t stop with the dollar and commodities. Both the
Dow and the S&P broke down through their up-trend lines early this week after
the Thanksgiving holiday ended. We have suggested that investors wait for
virtually all of the major indexes to break their up trend lines before turning
even short-term bearish on the market. While the S&P and Dow broke their trend
lines, the Nasdaq and Russell did not. And in fact both bounced perfectly off of
trend line support, shown in Chart 4, on Tuesday. The bounce had fairly good
breadth, but new highs have not yet been made in any major index. Therefore this
week’s lows in the Nasdaq and Russell are critical for investors to watch to get
a short-term trend feel for the market. A breakdown by all major averages below
this week’s lows would setup at least a more significant correction in the
market than we’ve witnessed since the July lows. As long as this week’s lows
hold, we suspect the bullish short-term trend deserves the benefit of a doubt.
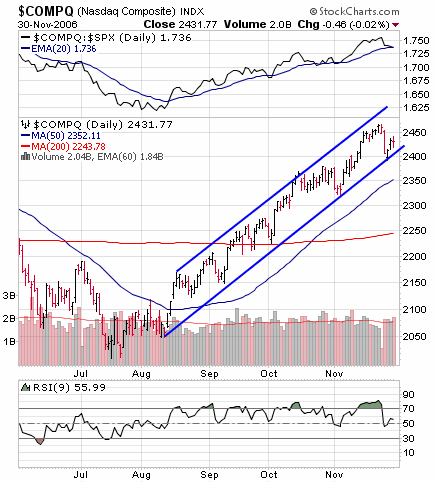
Chart 4: Nasdaq and Short-term Trend Channel Support. Courtesy StockCharts.com
This week has proven important for housing stocks potentially as well. Chart 5
shows the housing index breaking above its 200 ma on good volume. In a normal
housing crunch, when the NAHB Housing Index bottoms, housing stocks also bottom.
Many have suspected that this housing crunch is likely to be much worse than
normal however, so this may not be the case despite the NAHB index bottoming two
months ago. Yet housing stocks are starting to lean toward stabilization in
housing beginning. Particularly if the HGX can break above its 50% resistance
level around this week’s highs on good volume, it will suggest that the bad news
in housing will not accelerate and that housing stocks may well have put in a
bottom. For housing stocks to give such an indication would add further evidence
to the idea we have been putting forth since Spring that we are moving toward an
economic soft-landing and not an out-right recession. The action in housing
stocks from this point forward will be important to watch.
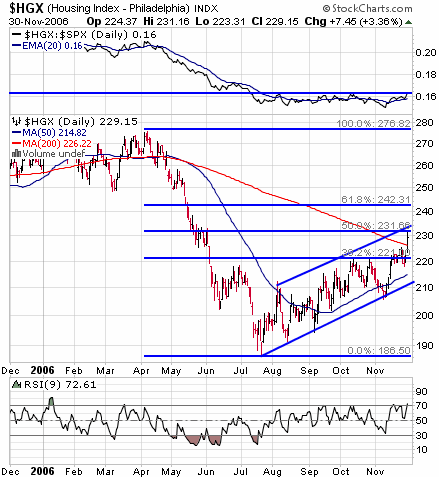
Chart 5: Housing Breakout Above 200 Day — Resistance Ahead Critical. Courtesy
StockCharts.com
Since this summer we’ve been somewhat cautious on the market and have long
suggested that investors have a large TLT (long Treasury Bond ETF) exposure to
balance out any net long stock exposure. This was partly done as a hedge against
potential recession and partly done because bonds are typically a more certain
trend higher going into an economic slowdown. As Chart 6 shows, bonds have done
very well since we’ve suggested such a strategy. In fact, as the top panel of
Chart 6 shows, the relative strength in bonds has matched that of the S&P since
the summer so that investors with TLT exposure have not fallen behind the
returns of the S&P, and in our opinion have done so with considerably more
safety. However, bonds are reaching levels where we would start to take some
profits. TLT’s have one resistance level around 92.5 that we think may be
formidable. Further ahead there is resistance from 96-98. Somewhere around 92 we
would BEGIN to shift out of bonds and TLT’s slowly over time. As the economic
slowdown becomes clearer in focus to be a soft-landing, bonds gains and utility
in a portfolio will start to diminish.
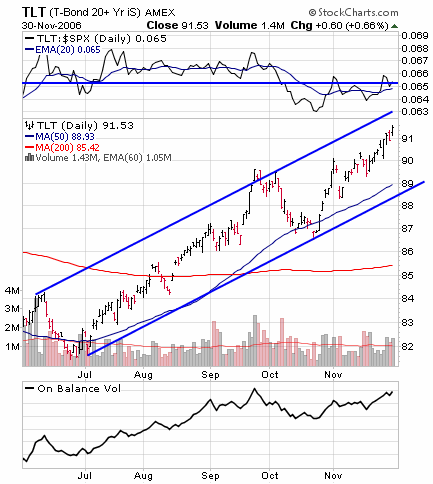
Chart 6: Bonds Kept Up With Stock Gains But Are Reaching Profit Levels. Courtesy
StockCharts.com
We continue to suggest less than aggressive allocation to global equities,
however we would no longer look to add or accumulate TLT’s on corrections and
would begin taking partial profits on TLT’s over 92. We still expect that the
slowdown is not over and that the Fed will not letup on a tightening bias until
the slowdown develops more clearly so that inflation does not reappear and get
entrenched, but bonds gains have been swift and and further rate drops will
become less likely unless a recession develops. The risk of recession is still
large enough that we would not suggest selling ALL or even half of TLT’s yet,
but some profit taking will soon be in order we believe. We also continue to
like some pairs, and some select big-cap dominated groups along with the small
number of stocks meeting our criteria for below normal allocation to stocks with
partial short-hedging in weaker groups.
Lots of bonds (TLT’s) and cash as well as light big-cap exposure still seems
prudent to us here until the environment becomes clearer. Long/short pairs and
some broad big-cap exposure to some of our preferred groups can be sparingly
participated in as well. The tradeoff between bonds and stocks should be closely
monitored as bonds are providing a critical cushion to the blow of a slowing
economy in what we suspect is a budding soft-landing that often prove difficult
to trade.
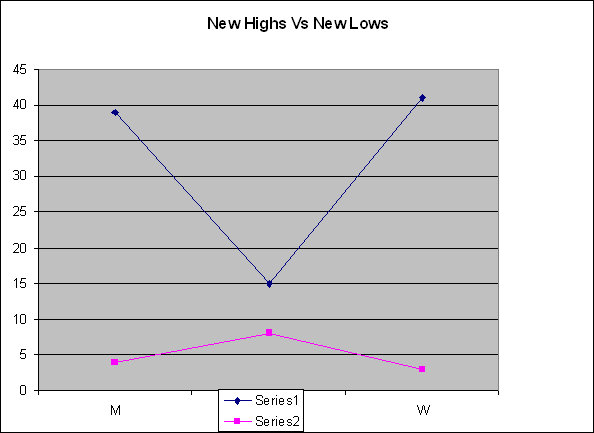
Our US selection methods, our Top RS/EPS New Highs list published on
TradingMarkets.com, had readings of 39,15 and 41 with 3 breakouts of 4+ week
ranges, valid trades meeting criteria in OPNT, BRCD, TV, and no close calls.
This week, our bottom RS/EPS New Lows recorded readings of 4, 8 and 3 with no
breakdowns of 4+ week ranges, no valid trades and no close calls. SPI, BWP, CHDX,
OTEX, OPNT, BRCD, TV remain open trades on the long side from this methodology.
Mark Boucher has been ranked #1 by Nelson’s World’s Best Money Managers for
his 5-year compounded annual rate of return of 26.6%.
For those not familiar with our long/short strategies, we suggest you review my
book “The Hedge Fund Edge“, my course “The
Science of Trading“, my video seminar, where I discuss many new techniques,
and my latest educational product, the
interactive training module. Basically, we have rigorous criteria for
potential long stocks that we call “up-fuel”, as well as rigorous criteria for
potential short stocks that we call “down-fuel”. His website is
www.midasresourcegroup.com.
