SPY and DIA Reach Pivotal Levels
Stocks traded in a narrow, sideways
range before finishing yesterday’s session near the flat line and with mixed
results. The S&P 500 gained 0.1% and the Dow
Jones Industrial Average advanced 0.2%, but the Nasdaq Composite took a breather
and declined 0.2%. The S&P Midcap 400 Index was also lower by 0.2%, while the
small-cap Russell 2000 fell 0.4%. Despite the tame action in the major indices,
leading stocks continued to show overall relative strength. Volatility in the
broad market was a bit subdued ahead of earnings reports by keystone companies
such as Intel, which reported after yesterday’s close.
Total volume in the NYSE declined by 2%, but volume in the
Nasdaq was 3% higher than the previous day’s level. Although the Nasdaq fell on
higher volume, both the minimal volume increase and small percentage drop were
not enough to technically register a bearish “distribution day.” After five
straight days of gains, it was more representative of a normal consolidation
instead. Both the S&P and Dow closed higher, but market internals in the NYSE
were fractionally negative, as declining volume in the NYSE exceeded advancing
volume by 1.1. The Nasdaq was negative by the same ratio.
Of all the major indices we follow, both the Nasdaq Composite
and Nasdaq 100 indices are the only ones that have firmly broken out to new
multi-year highs. However, many of the other indices have begun to test
resistance of their prior highs as well. Beginning with the S&P 500 SPDR
(
SPY |
Quote |
Chart |
News |
PowerRating), let’s take a look at how many of the broad-based ETFs are now testing
pivotal resistance levels:

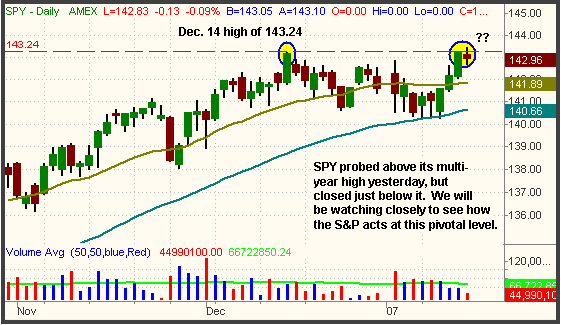
The multi-year intraday high on SPY is 143.24 and was set on
December 14. Yesterday, SPY traded 20 cents above that level, but closed just
below it. Over the next few days, many traders will be focused on whether or not
SPY (and the S&P 500) is able to convincingly break out to a new multi-year
high. If it does, it will confirm the strength in the Nasdaq, but inability to
overcome that resistance level could rapidly send SPY back down to test its
50-day moving average. If it comes back down to its 50-MA only a few days after
bouncing off it, the odds of a breakdown below the 50-MA would be much greater.
The DIAMONDS
(
DIA |
Quote |
Chart |
News |
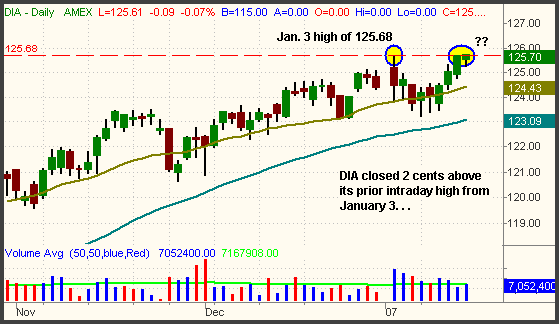
PowerRating), which mirrors the Dow Jones
Industrial Average, is similarly testing resistance of its multi-year high. As
you can see on the chart below, DIA closed just two cents above resistance of
its prior intraday high that was set on January 3. Because the Dow only consists
of thirty blue-chip stocks, it is not as representative of the stock market’s
health as the broad-based S&P 500, but the media and general public nevertheless
place a lot of emphasis on the state of the Dow. As such, it remains an
important indicator of sentiment:

The S&P Midcap SPDR
(
MDY |
Quote |
Chart |
News |
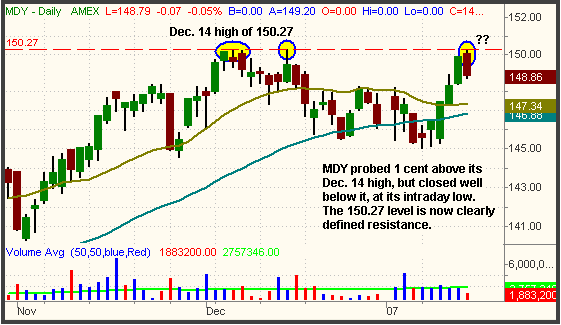
PowerRating) was another broad-based
ETF that tested resistance of its multi-year high yesterday. On December 14, MDY
traded up to an intraday high of 150.27, an all-time high for this ETF.
Yesterday morning, MDY traded exactly one cent above that level, then drifted
lower throughout the remainder of the session. Because the S&P Midcap 400 is
typically an accurate barometer of the broad market’s health, keep an eye on
that prior high from December 14 over the next few days:

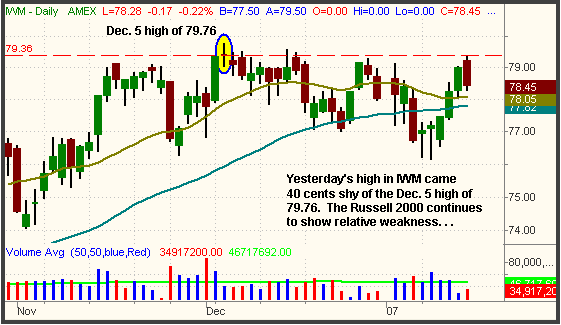
Curiously, the small-cap Russell 2000 has been showing the
most relative weakness in the new year. Over the past several years, the Russell
has led most bull markets, but we have been seeing bearish divergence over the
past few weeks. The iShares Russell 2000 [IWMIWM] recovered back above
its 50-day MA only three days ago, but yesterday’s intraday high came within
striking distance of its prior highs from last month:

A firm rally in IWM above yesterday’s high would be not only
bullish for the Russell 2000 index, but for the entire broad market as well.
However, it would not take a lot of selling pressure to push IWM back below its
50-day MA.
As you can see, many of the major indices are once again at
pivotal “make it or break it” levels. If the above indices can manage to close
solidly above yesterday’s highs, it will be a positive sign that confirms the
Nasdaq’s breakout. But, like we mentioned yesterday, the determining factor is
going to be the market’s reaction to the important earnings reports in the
coming days. Stay cautious and nimble and you’ll be okay.
Open ETF positions:
Long SMH, short EEM (regular subscribers to
The Wagner Daily
receive detailed stop and target prices on open positions and detailed setup
information on new ETF trade entry prices. Intraday e-mail alerts are also sent
as needed.)
Deron Wagner is the head trader
of Morpheus Capital Hedge Fund and founder of Morpheus Trading Group (morpheustrading.com),
which he launched in 2001. Wagner appears on his best-selling video, Sector
Trading Strategies (Marketplace Books, June 2002), and is co-author of both The
Long-Term Day Trader (Career Press, April 2000) and The After-Hours Trader
(McGraw Hill, August 2000). Past television appearances include CNBC, ABC, and
Yahoo! FinanceVision. He is also a frequent guest speaker at various trading and
financial conferences around the world. For a free trial to the full version of
The Wagner Daily or to learn about Deron’s other services, visit
morpheustrading.com or send an e-mail to
deron@morpheustrading.com .
