Tale of two techs: software vs semis
One of the implications
of a macro environment where business and capital investment is
expected to remain stronger than consumer demand as the economy weakens and as
housing influences discretionary incomes is that capital investment tech should
do better than tech that is influenced more heavily by an economic slowdown. We
can see this dichotomy being reflected by the technicals of the markets by
looking at the differing behavior of semiconductors, which are heavily cyclical
and dependent upon consumer electronic demand, versus software, which is more
influenced by business demand.

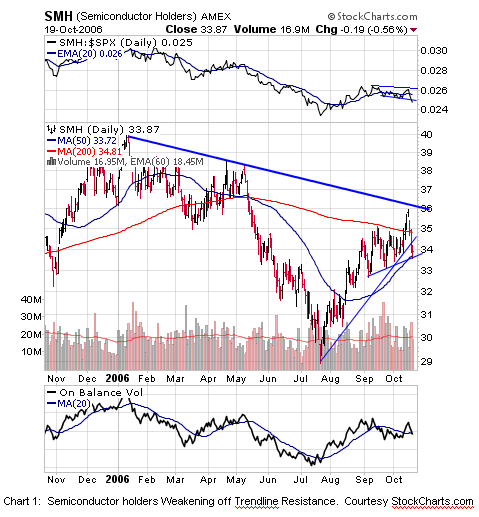
Chart 1 shows
(
SMH |
Quote |
Chart |
News |
PowerRating), the semiconductor i-shares
reacting sharply off of the down trend line from the January highs to the May
highs. The downside has broken an uptrend line from the July lows and is
threatening the up trend line from the August-September lows as well. Moreover
the top section of chart 1 shows the long-term down trend in the relative
strength of SMH versus the S&P. Note that SMH’s relative strength has just
broken down below August-Sept support. The combination of trend line resistance
leading to a steep decline and the failure of a down trending relative strength
suggests that semiconductors should continue to show poor relative strength.
Those investors looking to hedge some long exposure as the Nasdaq tests its high
might do well to consider SMH as one of a basket of short-hedges against big
caps, pharmaceuticals, defense, and other strong areas where long exposure has
been suggested.

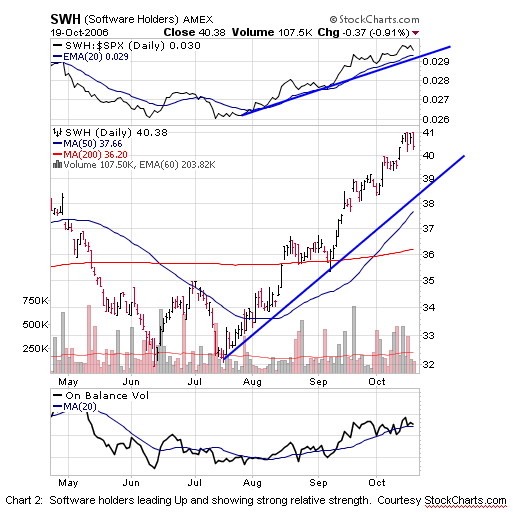
Chart 2 shows the daily chart of software holders
in a strong up trend. The upper panel also shows
(
SWH |
Quote |
Chart |
News |
PowerRating) in a clear up trend
of relative strength versus the S&P. Thus semis are displaying weak relative
strength at the same time software is displaying strong relative strength.
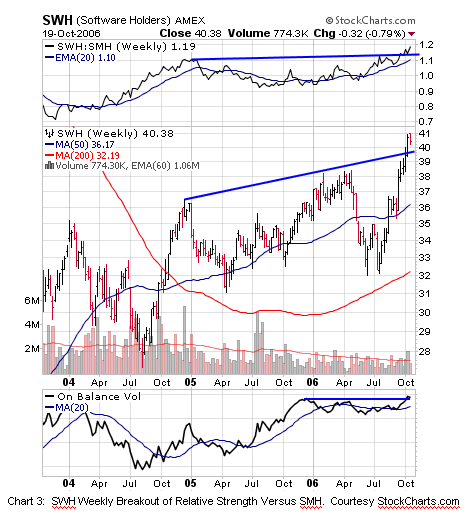
Therefore it should be no surprise that the
weekly chart of SWH versus SMH is breaking out to new multi-year highs (top
panel of chart 3) at the same time SWH is moving higher in price. In chart 3
the top panel compares SWH not to the S&P as in the former two charts, but to
SMH, the semiconductor holders. The ratio or paired trade of SWH over SMH is
breaking out to new highs and has been exhibiting clear strength since May.
Investors looking for long exposure might want to
take a close look at SWH and software stocks breaking out. Investors looking
for hedges against an extended market, might want to consider a basket of shorts
that includes the weak semis ala SMH. And investors more neutral on the market
direction might consider the paired trade SWH/SMH in the period ahead.

We still suggest less than aggressive allocation to global equities and would
look to add or accumulate TLT’s on this correction as we expect that the
slowdown is not over and that the Fed will not letup on a tightening bias until
the slowdown develops more clearly so that inflation does not reappear and get
entrenched. We like some pairs (like EWP/EWG, PPH over the market, and SWH/SMH),
and some select big-cap dominated groups (Pharma, Defense, Software) along with
the small number of stocks meeting our criteria for below normal allocation to
stocks.
Our US selection methods, our Top RS/EPS New
Highs list published on TradingMarkets.com, had readings of 112, 88, 115, 19 and
28 with 20 breakouts of 4+ week ranges, no valid trades meeting criteria , and
no close calls. This week, our bottom RS/EPS New Lows recorded readings of 5,
4, 4, 1 and 1 with no breakdowns of 4+ week ranges, no valid trades and no close
calls. TWGP and SPI remain open trades on the long side from this methodology,
and both can be followed up with break even or better trailing stops at this
time.
Lots of bonds and cash as well as light big-cap
exposure still seems prudent to us here until the environment becomes clearer.
Long/short pairs and some big-cap exposure to areas like pharmaceuticals and
defense can be sparingly participated in as well. Big cap stocks have rallied
on a Wall of Worry recently, but the setback in bonds may mean that wall is
getting steeper ahead.

Mark Boucher has been ranked #1 by Nelson’s World’s Best Money Managers for
his 5-year compounded annual rate of return of 26.6%.
For those not familiar with our long/short strategies, we suggest you review my
book “The Hedge Fund Edge“, my course “The
Science of Trading“, my video seminar, where I discuss many new techniques,
and my latest educational product, the
interactive training module. Basically, we have rigorous criteria for
potential long stocks that we call “up-fuel”, as well as rigorous criteria for
potential short stocks that we call “down-fuel”. His website is
www.midasresourcegroup.com.
