The Bulls Were Back in Charge on Monday
Today was a good day for the bulls.
The S&P 500 hit another new high. Meanwhile the Dow, Nasdaq, and other broad
measures all rallied nicely. As I’ve been saying for the last few weeks, I
believe we are in a market prone to oscillations. I feel the easiest way to may
money in a market like this is to play those oscillations. SPY and MDY seem to
be the most stretched at this point. They will most likely provide the most
snap-back power to the downside. I feel it is time to start scaling in short and
I have begun to do so.
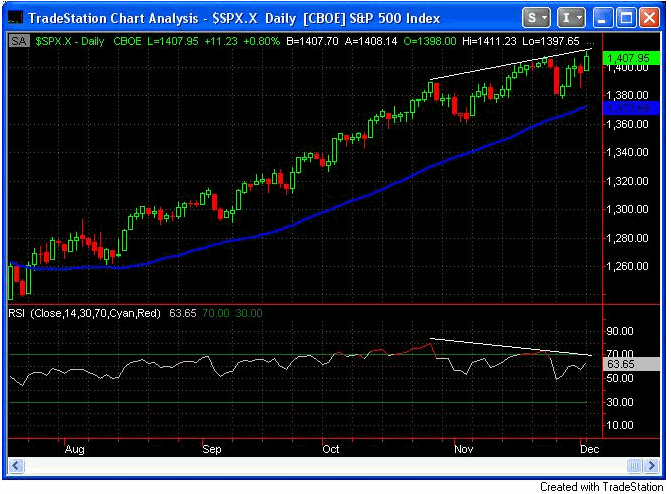
Today I’d like to look at a few charts. The first is an
updated chart of the S&P 500 with the 14-day RSI shown at the bottom. Higher
price highs and lower RSI highs are becoming common. This is not encouraging for
the bulls. Please see my November 13th column for a detailed discussion of this.
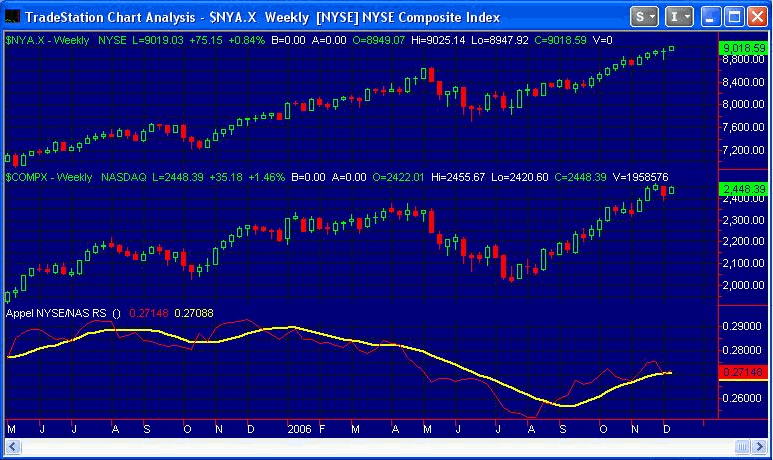
This next chart depicts the Relative Strength of the Nasdaq
vs. the NYSE. Historically, when the Nasdaq has lagged, the market has struggled
to make headway. This concept was illustrated quite nicely in Gerald Appel’s
book “Technical Analysis — Power Tools for Active Investorsâ€. In the book, Mr.
Appel suggests using a 10-week relative strength indicator to measure the
strength of the Nasdaq vs. the NYSE. This is what I’ve done in the chart below.
The way the indicator works is as follows: When the red line is above the yellow
line, the Nasdaq is leading the NYSE. When the red line is below the yellow
line, the Nasdaq is lagging the NYSE. Since 1971, nearly 100% of the market’s
gains have occurred when the Nasdaq is leading rather than lagging. Friday was
the 1st time this indicator switched directions since the Nasdaq took the lead
at the end of August. This may be a blip, as the red line is higher for this
week so far. It will be interesting to see how this week finishes out and if we
start to see some separation. Should the red line continue to sink, that could
be a bad sign.
The bulls are back in charge again today, and there is nothing
wrong with that. But there appears to be some froth, and rather than getting
caught up in the excitement, I believe it’s likely a better idea to play the
overreactions.
Best of luck with your trading,
Rob
Rob Hanna is the principal of a money
management firm located in Massachusetts. He has spent the last several years
developing and refining methods for trading in stocks across multiple time
frames. He selects stocks using both fundamental and technical criteria, and
then trades them using technical analysis techniques.