The Nasdaq Snaps Back
A solid earnings report from Internet
giant Yahoo! enabled the Nasdaq Composite to snap back above its 50-day MA,
pulling the rest of the broad market with it. After gapping firmly
higher on yesterday’s open, stocks trended steadily higher throughout the rest
of the session before closing at their intraday highs. The Nasdaq Composite
zoomed to a 1.4% gain, while the small-cap Russell 2000 tailed closely behind
with a 1.1% advance. The S&P 500 rallied 0.9%, the Dow Jones Industrial Average
0.7%, and the S&P Midcap 400 1.0%. Both the Dow and S&P Midcap indices finished
at fresh all-time highs, while the S&P 500 closed at a new six-year high.
Total volume in the NYSE declined by 5%, but volume in the
Nasdaq was 8% higher than the previous day’s level. After two days of higher
volume selling last week and three within the past four weeks, yesterday’s
"accumulation day" was a welcome change for the Nasdaq. Strong market internals
confirmed the bullishness. Advancing volume in the Nasdaq exceeded declining
volume by a ratio of 5 to 1, while the NYSE was positive by a margin of 3 to 1.
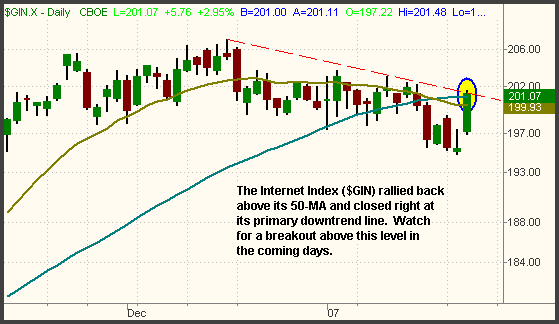
An impressive reaction to Yahoo!’s earnings report enabled the
Internet Index ($GIN) to recover back above its 50-day MA that it traded below
in each of the past five days. It also closed right at resistance of its daily
downtrend line that has been in place since the high of December 15. If the $GIN
rallies and closes above yesterday’s high, it will have broken out above
convergence of its 50-MA and downtrend line:

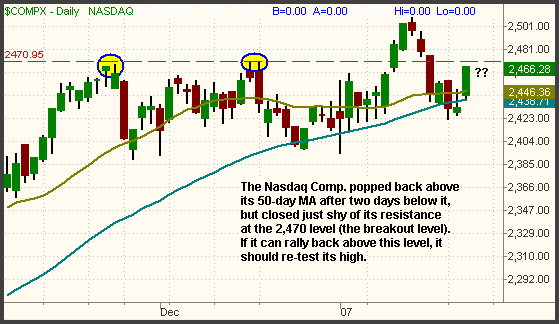
After two closing below it in the prior two days, the Nasdaq
Composite rallied to finish above its 50-MA again. However, it closed just shy
of resistance of its prior high at the 2,470 level. The horizontal line on the
daily chart below illustrates this resistance:

We expect a test of the 2,470 resistance level in the coming
days. If the index pops back above it, the Nasdaq could easily follow the S&P in
rallying to a new six-year high. Support will be found at yesterday’s low, which
is in the vicinity of the 50-day MA.
Since the beginning of the year, the market has been rather
indecisive. Just as it appears that many of the major indices are going to roll
over, one of the indices suddenly rallies above resistance. Then, after the
index breaks out, thinking the selling is finished, the weakness sets in again.
This, of course, is the classic behavior of a sideways, range-bound market.
Trying to predict the market’s next move will likely result in the costly
proposition of churning your account. While yesterday’s action certainly makes
an argument for the bullish side of the market, this is not the time to
be overly aggressive with the quantity and share size of your positions. Take it
easy until earnings season is finished. Trends should start to become more clear
when the corporate report cards are behind us.
Open ETF positions:
Long
(
QID |
Quote |
Chart |
News |
PowerRating),
(
GLD |
Quote |
Chart |
News |
PowerRating) (regular subscribers to
The Wagner Daily receive detailed stop and target prices on open
positions and detailed setup information on new ETF trade entry prices. Intraday
e-mail alerts are also sent as needed.)
Deron Wagner is the head trader of Morpheus Capital Hedge
Fund and founder of Morpheus Trading Group (morpheustrading.com),
which he launched in 2001. Wagner appears on his best-selling video, Sector
Trading Strategies (Marketplace Books, June 2002), and is co-author of both The
Long-Term Day Trader (Career Press, April 2000) and The After-Hours Trader
(McGraw Hill, August 2000). Past television appearances include CNBC, ABC, and
Yahoo! FinanceVision. He is also a frequent guest speaker at various trading and
financial conferences around the world. For a free trial to the full version of
The Wagner Daily or to learn about Deron’s other services, visit
morpheustrading.com or send an e-mail
to deron@morpheustrading.com .
