Using Bollinger bands to time breakouts
After essentially trading sideways
for nearly 3 weeks, the QQQQ’s broke out last week and charged higher
by about 5.5%. This week we have seen some give-back to this move, frustrating
those who thought they might be able to get a little more out of their long
positions. The question for many traders when dealing with quick, explosive
moves like last week is, how do I know when the move is likely at or near its
end? When might be a good time to take profits on these type of moves?
One method that I have found to be valuable is offered by John
Bollinger in his book, “Bollinger on Bollinger Bandsâ€. On page 123 he writes
“When a powerful trend is born, volatility expands so much that the lower band
will turn down in an uptrend or the upper band will turn up in a downtrend. When
that happens, it is an Expansion, and when the Expansion reverses, the odds are
very high that the trend is at an end. That doesn’t necessarily mean the entire
move is over. Another leg could easily materialize. But it does mean that the
current leg is most likely over. The realistic expectation is now for a
consolidation or reversal, not the continuation of the trend everybody is hoping
for.â€
Let’s look at a chart of QQQQ to illustrate what Mr. Bollinger
is saying:
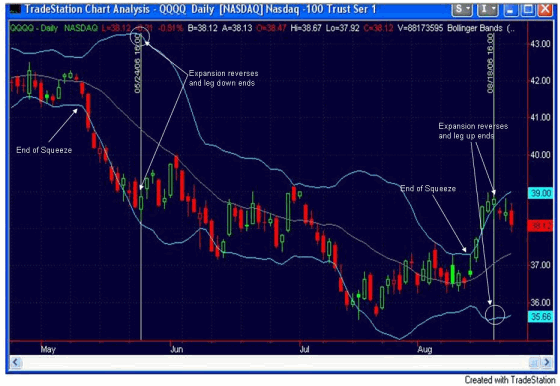
As you can see, after the recent tight trading range caused
the Bollinger Bands to squeeze together, the QQQQ’s sharply broke upward. The
upward move stalled when the lower Bollinger Band began to curl upwards. If you
look back to May, you’ll notice a similar result in the opposite direction. A
sharp move down occurred after a tight consolidation. The move lasted until the
upper Bollinger Band began to curl downwards — at which point it stalled and
drifted higher for a little over a week before the next leg down began.
This is just one method traders may use to anticipate when a
move may be ending. It is one I have found to be quite effective, and has been a
nice addition to my “bag of tricks†since I encountered it. By the way, I highly
recommend “Bollinger
on Bollinger Bands†for those who haven’t read it.
Best of luck with your trading,
Rob Hanna
Rob Hanna is the principal of a money
management firm located in Massachusetts. He has spent the last several years
developing and refining methods for trading in stocks across multiple time
frames. He selects stocks using both fundamental and technical criteria, and
then trades them using technical analysis techniques.