Watching for Further Market Weakness
Downward momentum from the previous
day’s selloff caused stocks to move lower last Friday morning, but the major
indices stabilized and recovered in the afternoon, eventually settling near
unchanged levels. The Nasdaq Composite eked out
a 0.1% gain, but both the S&P 500 and Dow Jones Industrial Average closed 0.1%
lower. Small and midcap stocks showed relative strength, enabling the Russell
2000 and S&P Midcap 400 indices to advance 0.5% and 0.3% respectively. Total
volume in the NYSE declined by 14%, while volume in the Nasdaq was 9% lower than
the previous day’s level. In both exchanges, advancing volume fractionally
exceeded declining volume.
Despite the small gain in the Nasdaq Composite, the less
diversified Nasdaq 100 Index still lost 0.3%. The decline caused our long
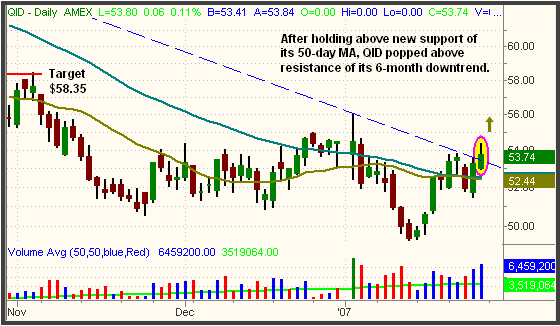
position in the UltraShort QQQ ProShares [QIDQID] to gain another 1% and
close at its highest level since January 3. Not only is QID building a base
above its 50-day MA, but it also closed last Friday above its primary downtrend
line that has been in place since the high of July 2006:

As long as the Nasdaq 100 remains below last Friday’s high,
QID will remain above new support of its prior downtrend line illustrated above.
If it does, bullish momentum should carry QID higher in the short-term. Our
price target on the swing trade is just below resistance of the prior high from
November 3, around $58.35.
Although the first three weeks of the month have been quite
erratic and indecisive for the Nasdaq Composite, the index may finally be
positioned to make a solid move (downward) out of its ten-week trading range.
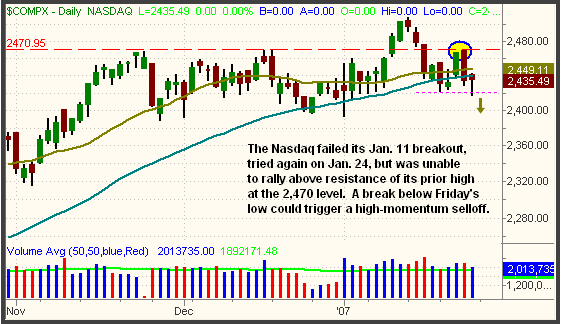
Let’s take an updated look at its daily chart:

On January 11, the Nasdaq Composite broke out above its
sideways range and closed at a new six-year high. But only four days later, the
index failed the breakout by falling back down to the middle of its prior range.
Support of the 50-day MA subsequently caught the Nasdaq again, prompting the
index to make another run at breaking out, but it was unable to overcome
resistance of the prior high at the 2,470 level (the dashed horizontal line).
Overhead supply created from the sharp selloff of January 25 now makes it even
more difficult for the Nasdaq to recover back above the 2,470 resistance. Given
that the Nasdaq has closed four of the past five sessions just below its 50-day
MA, it also won’t take a lot of additional selling pressure to trigger a swift
breakdown below the range.
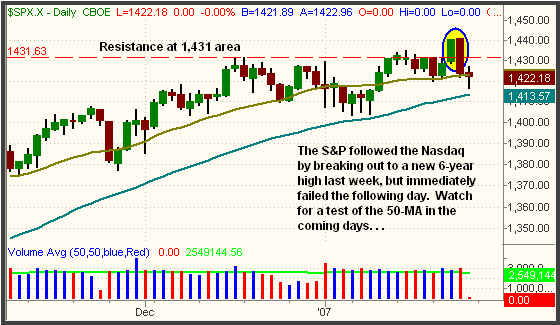
The daily charts of the S&P 500 and Dow Jones Industrial
Average are both different than the Nasdaq, but they nevertheless had failed
breakouts last week. Just at the Nasdaq did on January 11, the S&P 500 broke out
and finished at a fresh six-year high on January 24. However, the Nasdaq’s 2,470
resistance level that triggered the January 25 selloff had an equally negative
affect on the S&P as well. The S&P immediately failed its breakout and finished
last week just above its 50-day MA. Be prepared for another test of the 50-MA in
the coming days. Though the 50-day MA is always an important support level,
failed breakouts that precede a test of the 50-MA increase the odds of a
breakdown below the 50-MA support:

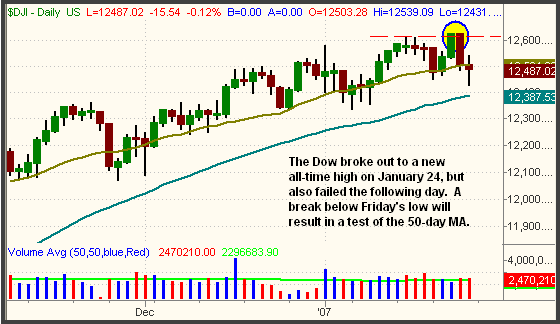
The Dow has a very similar chart pattern as the S&P, as it
broke out to a new (all-time) high on January 24, failed badly on January 25,
then closed last week just above its 50-day MA:

Given the unpredictable and whippy nature of the broad market
throughout most of January, we are not yet feeling very confident that the major
indices will each crack their 50-day MAs in the coming week, but we are equally
reluctant to believe they will rally back up to new highs. Presently, we are
lightly positioned with shares of only QID and GLD (StreetTRACKS Gold Trust),
both of which are showing unrealized gains. If the S&P and/or Dow firmly break
last week’s lows and their 50-MAs, we will probably initiate new short
positions, but we are currently taking a “wait and see” stance. On the long
side, we were stalking the Biotech HOLDR
(
BBH |
Quote |
Chart |
News |
PowerRating) and Internet
HOLDR
(
HHH |
Quote |
Chart |
News |
PowerRating) for possible entries, but both ETFs finished last week below
their breakout levels. Therefore, we will pass on buying these ETFs unless
they immediately stabilize and move back above their pivots. Be prepared for a
lot of volatility in the last several days of the month, and remember to
trade what you see, not what you think!
Open ETF positions:
Long QID, GLD (regular subscribers to
The Wagner Daily
receive detailed stop and target prices on open positions and detailed setup
information on new ETF trade entry prices. Intraday e-mail alerts are also sent
as needed.)
Deron Wagner is the head trader
of Morpheus Capital Hedge Fund and founder of Morpheus Trading Group (morpheustrading.com),
which he launched in 2001. Wagner appears on his best-selling video, Sector
Trading Strategies (Marketplace Books, June 2002), and is co-author of both The
Long-Term Day Trader (Career Press, April 2000) and The After-Hours Trader
(McGraw Hill, August 2000). Past television appearances include CNBC, ABC, and
Yahoo! FinanceVision. He is also a frequent guest speaker at various trading and
financial conferences around the world. For a free trial to the full version of
The Wagner Daily or to learn about Deron’s other services, visit
morpheustrading.com or send an e-mail to
deron@morpheustrading.com .
